Application Signals
CloudWatch Application Signals helps you monitor and improve application performance on Amazon. It automatically collects data from your applications running on services like Amazon EC2, Amazon ECS, and Lambda. You can use CloudWatch Application Signals for the following:
Monitor application health in real time
Track performance against business goals
View relationships between services and dependencies
Quickly identify and resolve performance issues
-
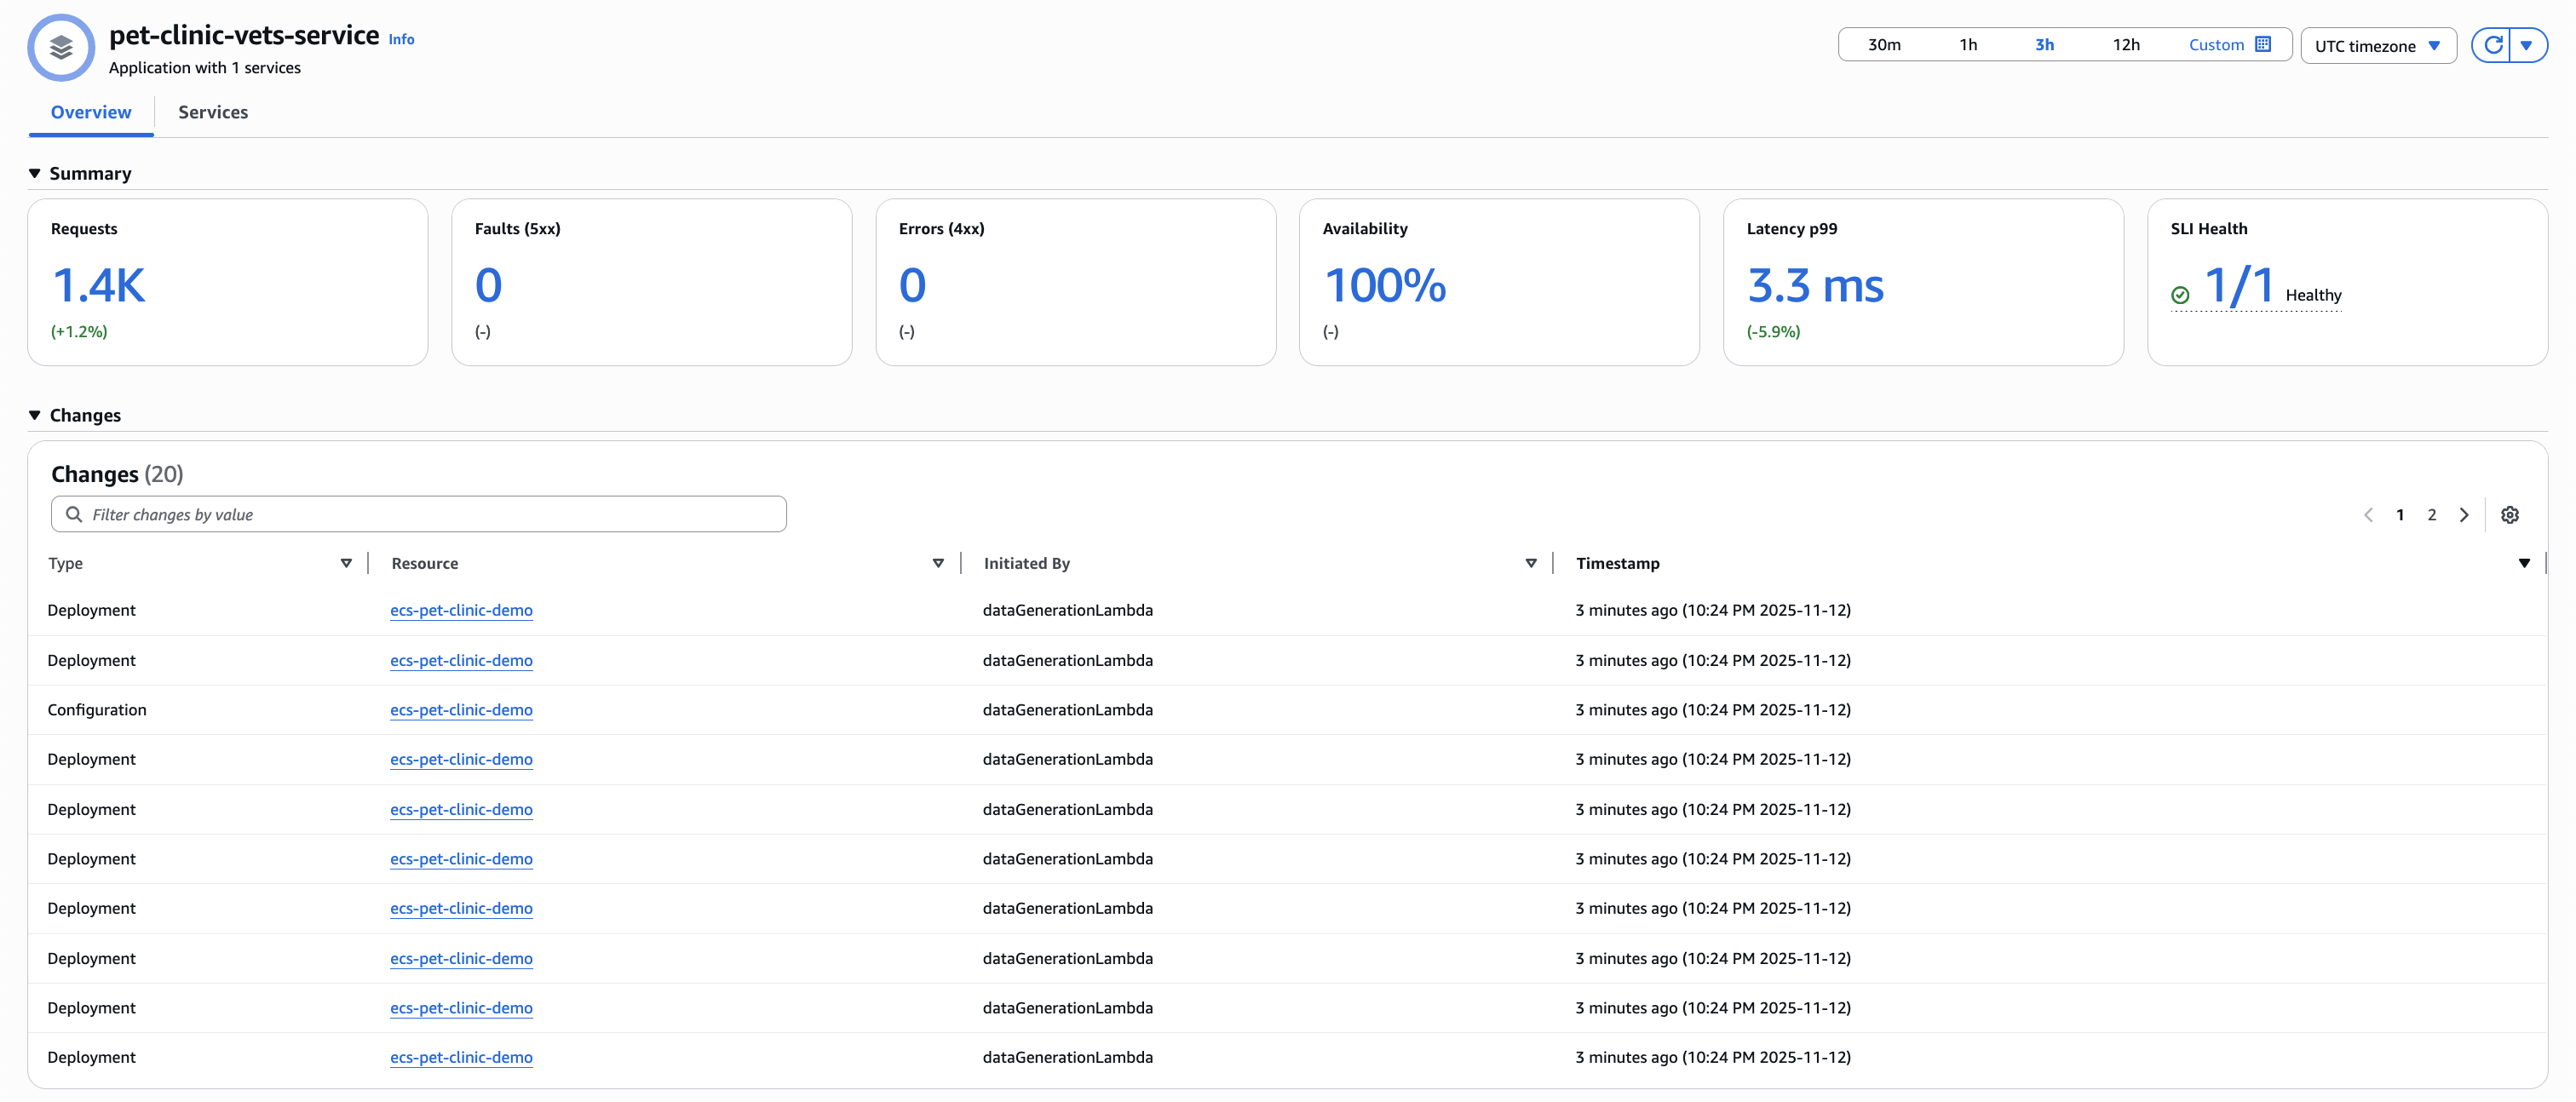
Enable Application Signals to automatically collect metrics and traces from your applications, and display key metrics such as call volume, availability, latency, faults, and errors. Quickly see and triage current operational health, and whether your applications are meeting their longer-term performance goals, without writing custom code or creating dashboards.
-
Create and monitor service-level objectives (SLOs) with Application Signals. Easily create and track status of SLOs related to CloudWatch metrics, including the new standard application metrics that Application Signals collects. See and track the service level indicator (SLI) status of your application services within a services list and topology map. Create alarms to track your SLOs, and track the new standard application metrics that Application Signals collects.
-
See a map of your application topology that Application Signals automatically discovers, that gives you a visual representation of your applications, dependencies, and their connectivity.
-
Application Signals works with CloudWatch RUM, CloudWatch Synthetics canaries, Amazon Service Catalog AppRegistry, and Amazon EC2 Auto Scaling to display your client pages, Synthetics canaries, and application names within dashboards and maps.
Supported languages and architectures
Application Signals supports Java, Python, Node.js, and .NET applications.
Application Signals is supported and tested on Amazon EKS, Amazon ECS, and Amazon EC2. On Amazon EKS clusters, it automatically discovers the names of your services and clusters. On other architectures, you must supply the names of services and environments when you enable those services for Application Signals.
The instructions for enabling Application Signals on Amazon EC2 should work on any architecture that supports the CloudWatch agent and Amazon Distro for OpenTelemetry. However, the instructions have not been tested on architectures other than Amazon ECS and Amazon EC2.
Supported Regions
Application Signals is supported in every commercial Region except for Canada West (Calgary).
Features
Use Application Signals for daily application monitoring – Use Application Signals within the CloudWatch console, as part of daily application monitoring:
-
If you have created service level objectives (SLOs) for your services, start with the Service Level Objectives (SLO) page. This gives you an immediate view of the health of your most critical services, operations, and dependencies. Choose the service, operation, or dependency name for an SLO to open the Service detail page and see detailed service information as you troubleshoot issues.
-
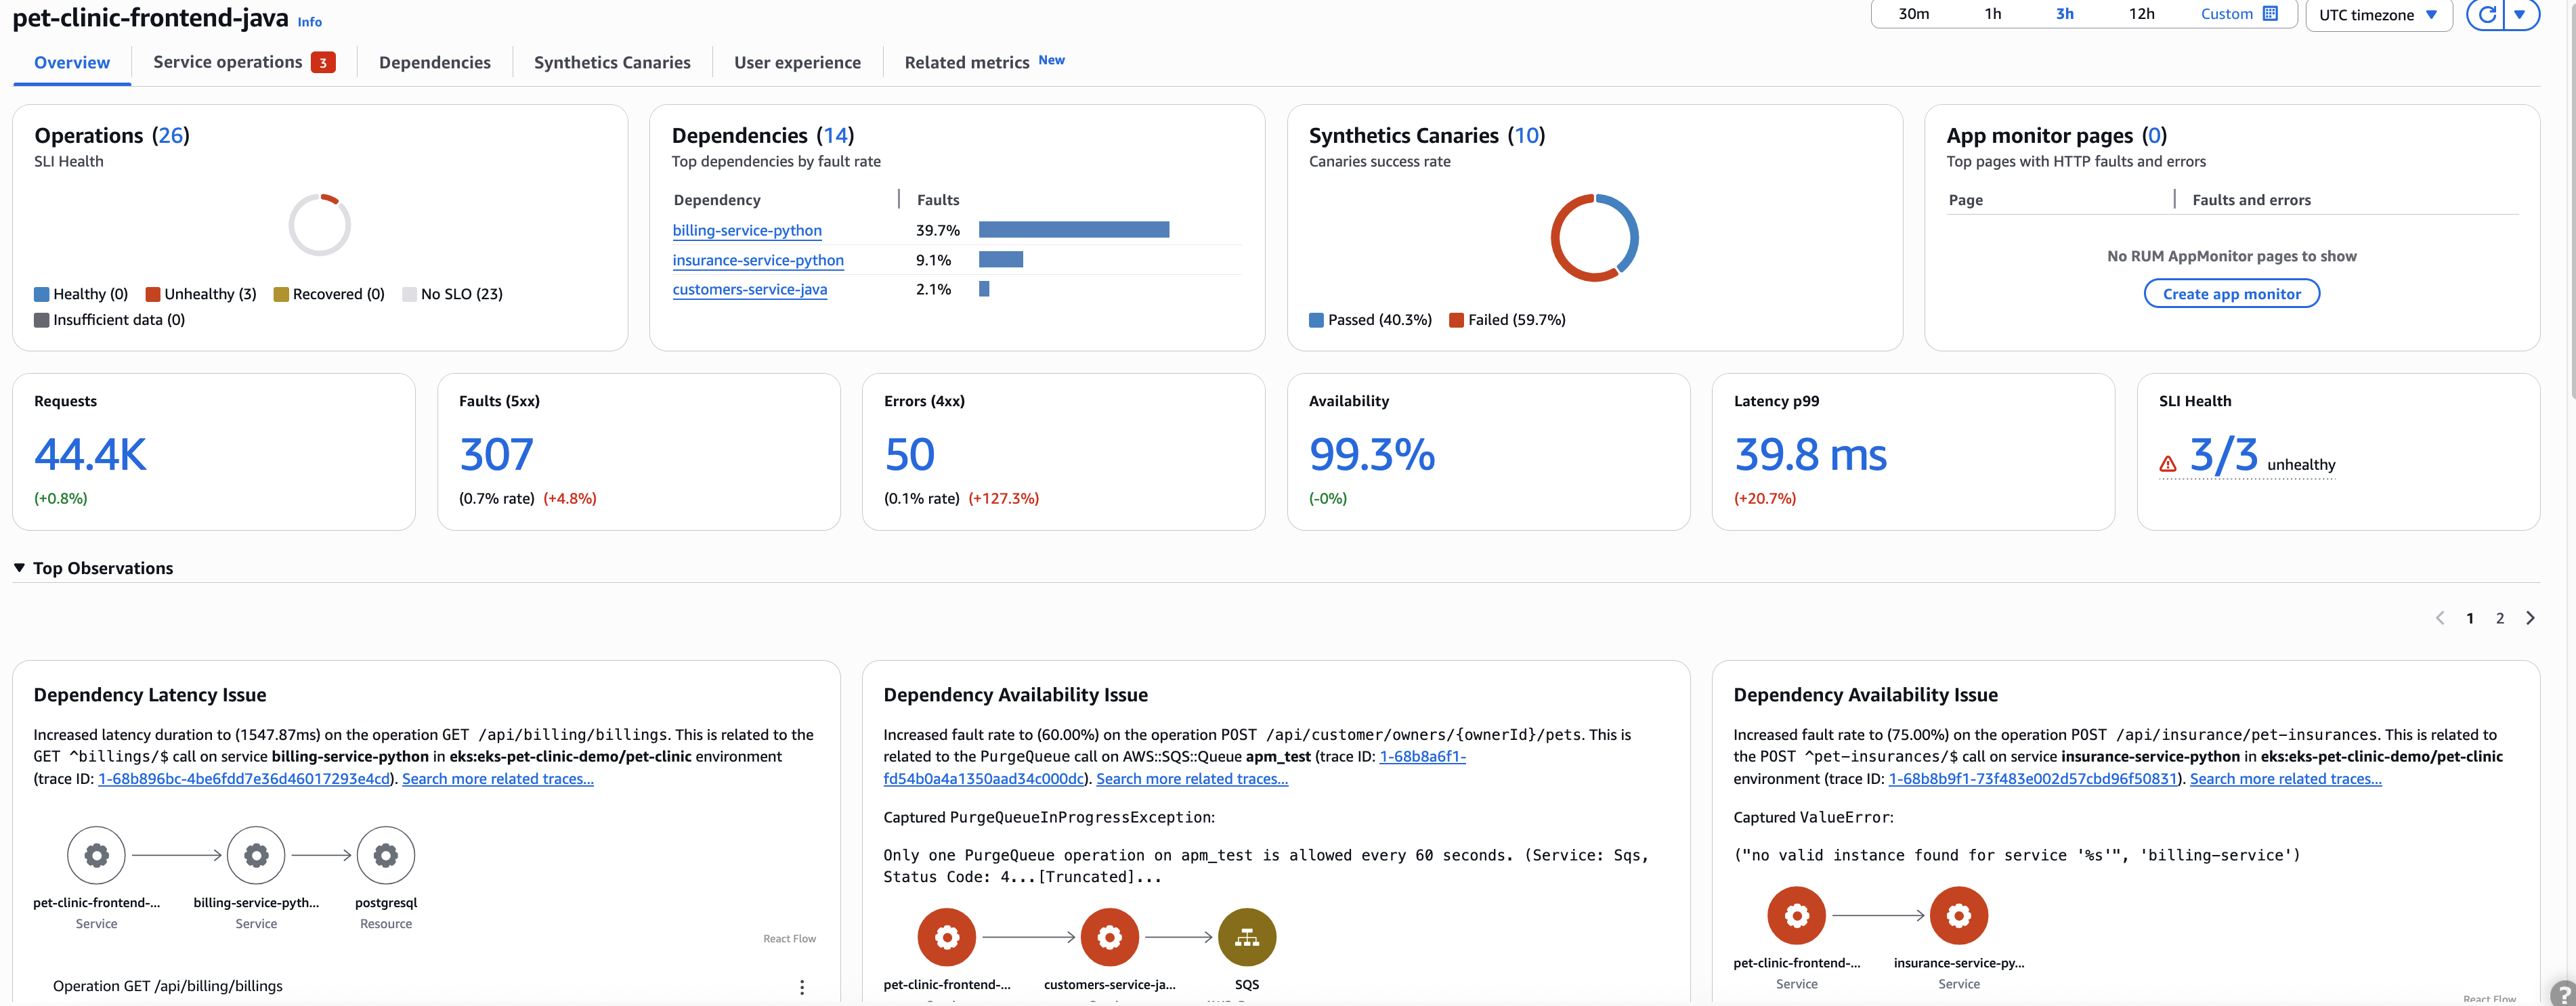
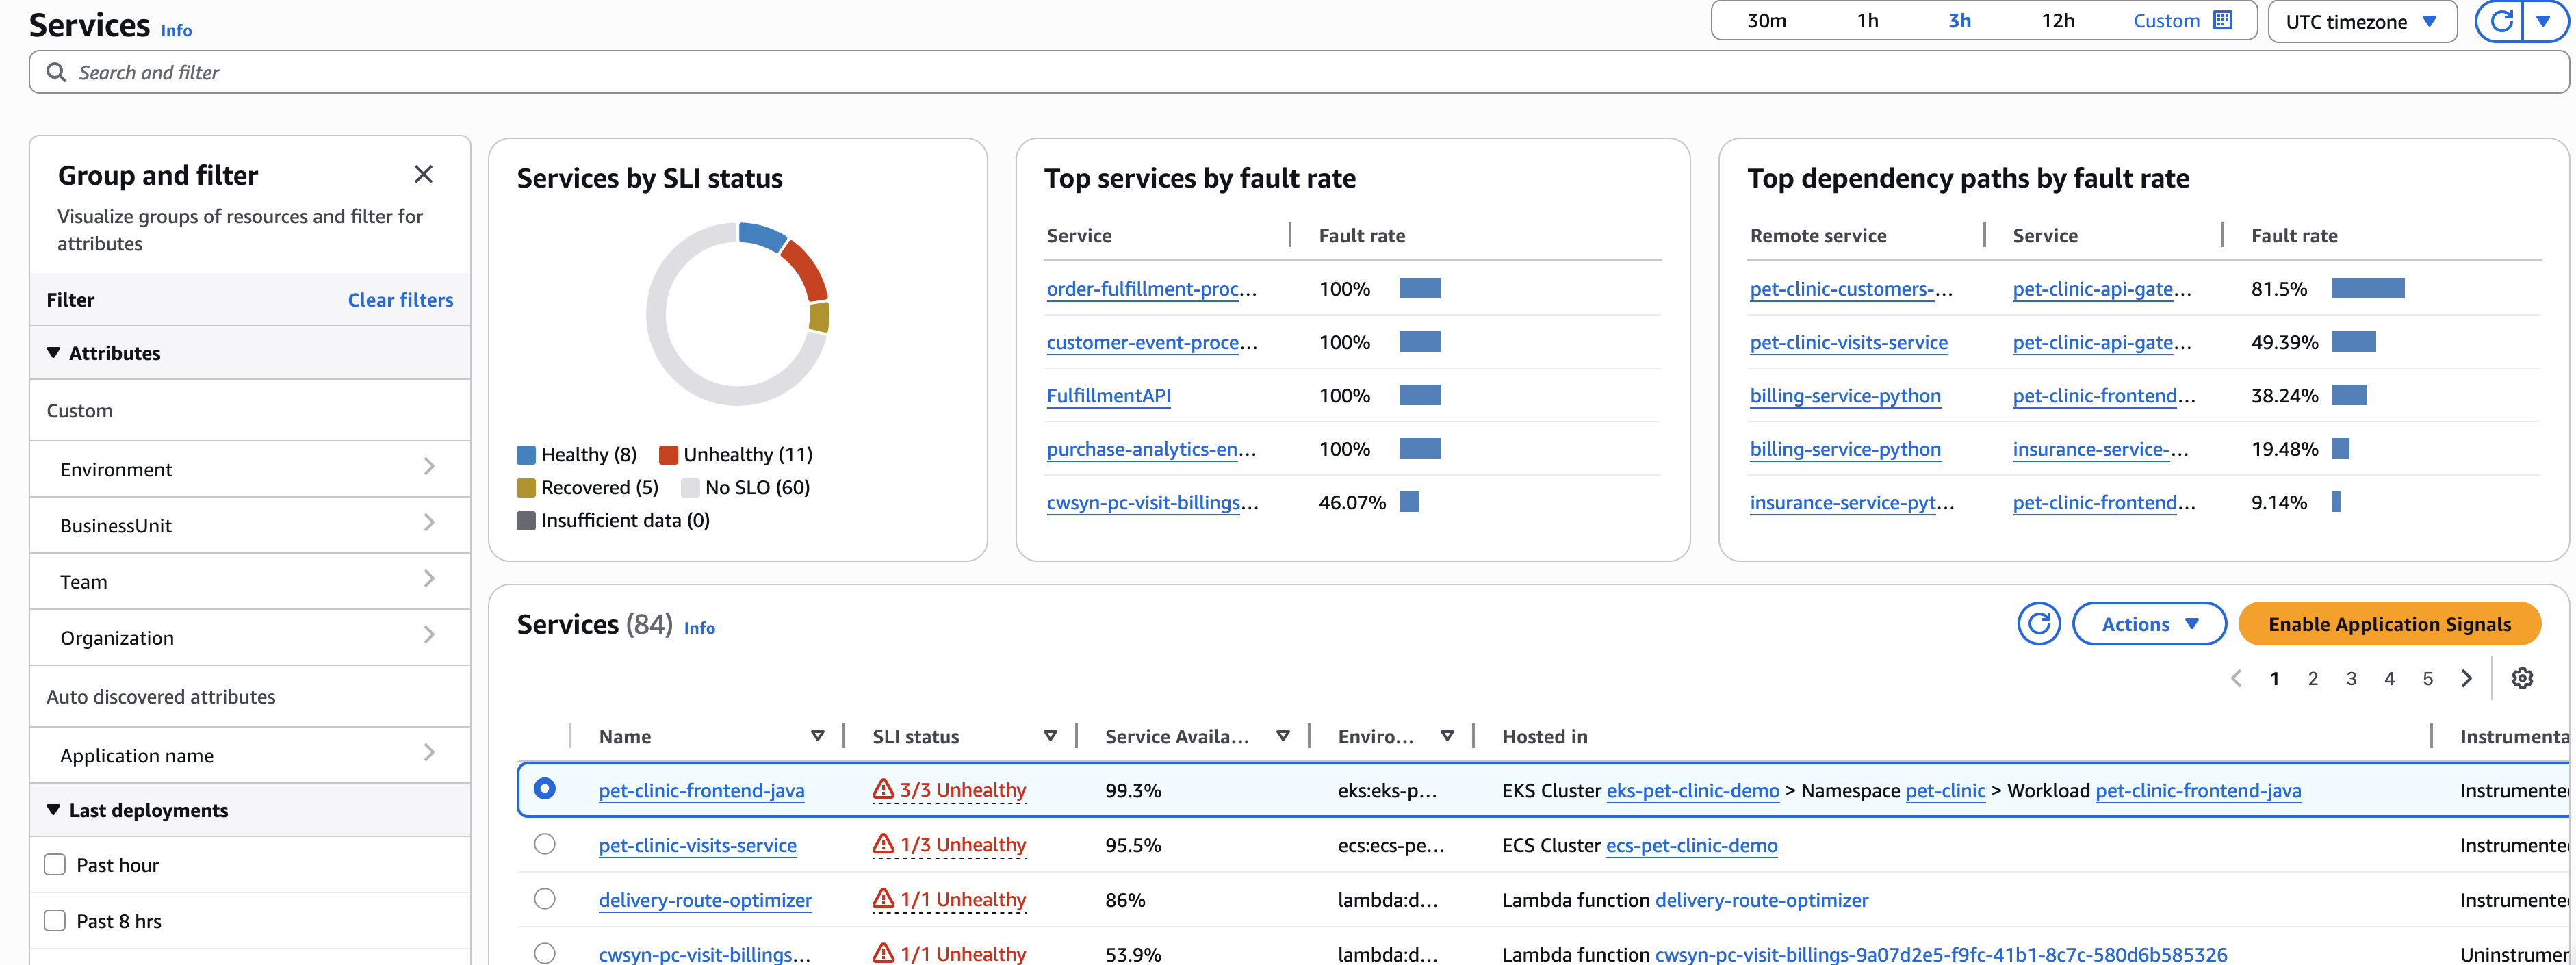
Open the Services page to see a summary of all your services, and quickly see services with the highest fault rate or latency. If you have created SLOs, look at the Services table to see which services have unhealthy service level indicators (SLIs). If a particular service is in an unhealthy state, select the service to open the Service detail page and see service operations, dependencies, Synthetics canaries, and client requests. Select a point in a graph to see correlated traces so that you can troubleshoot and identify the root cause of operational issues.
-
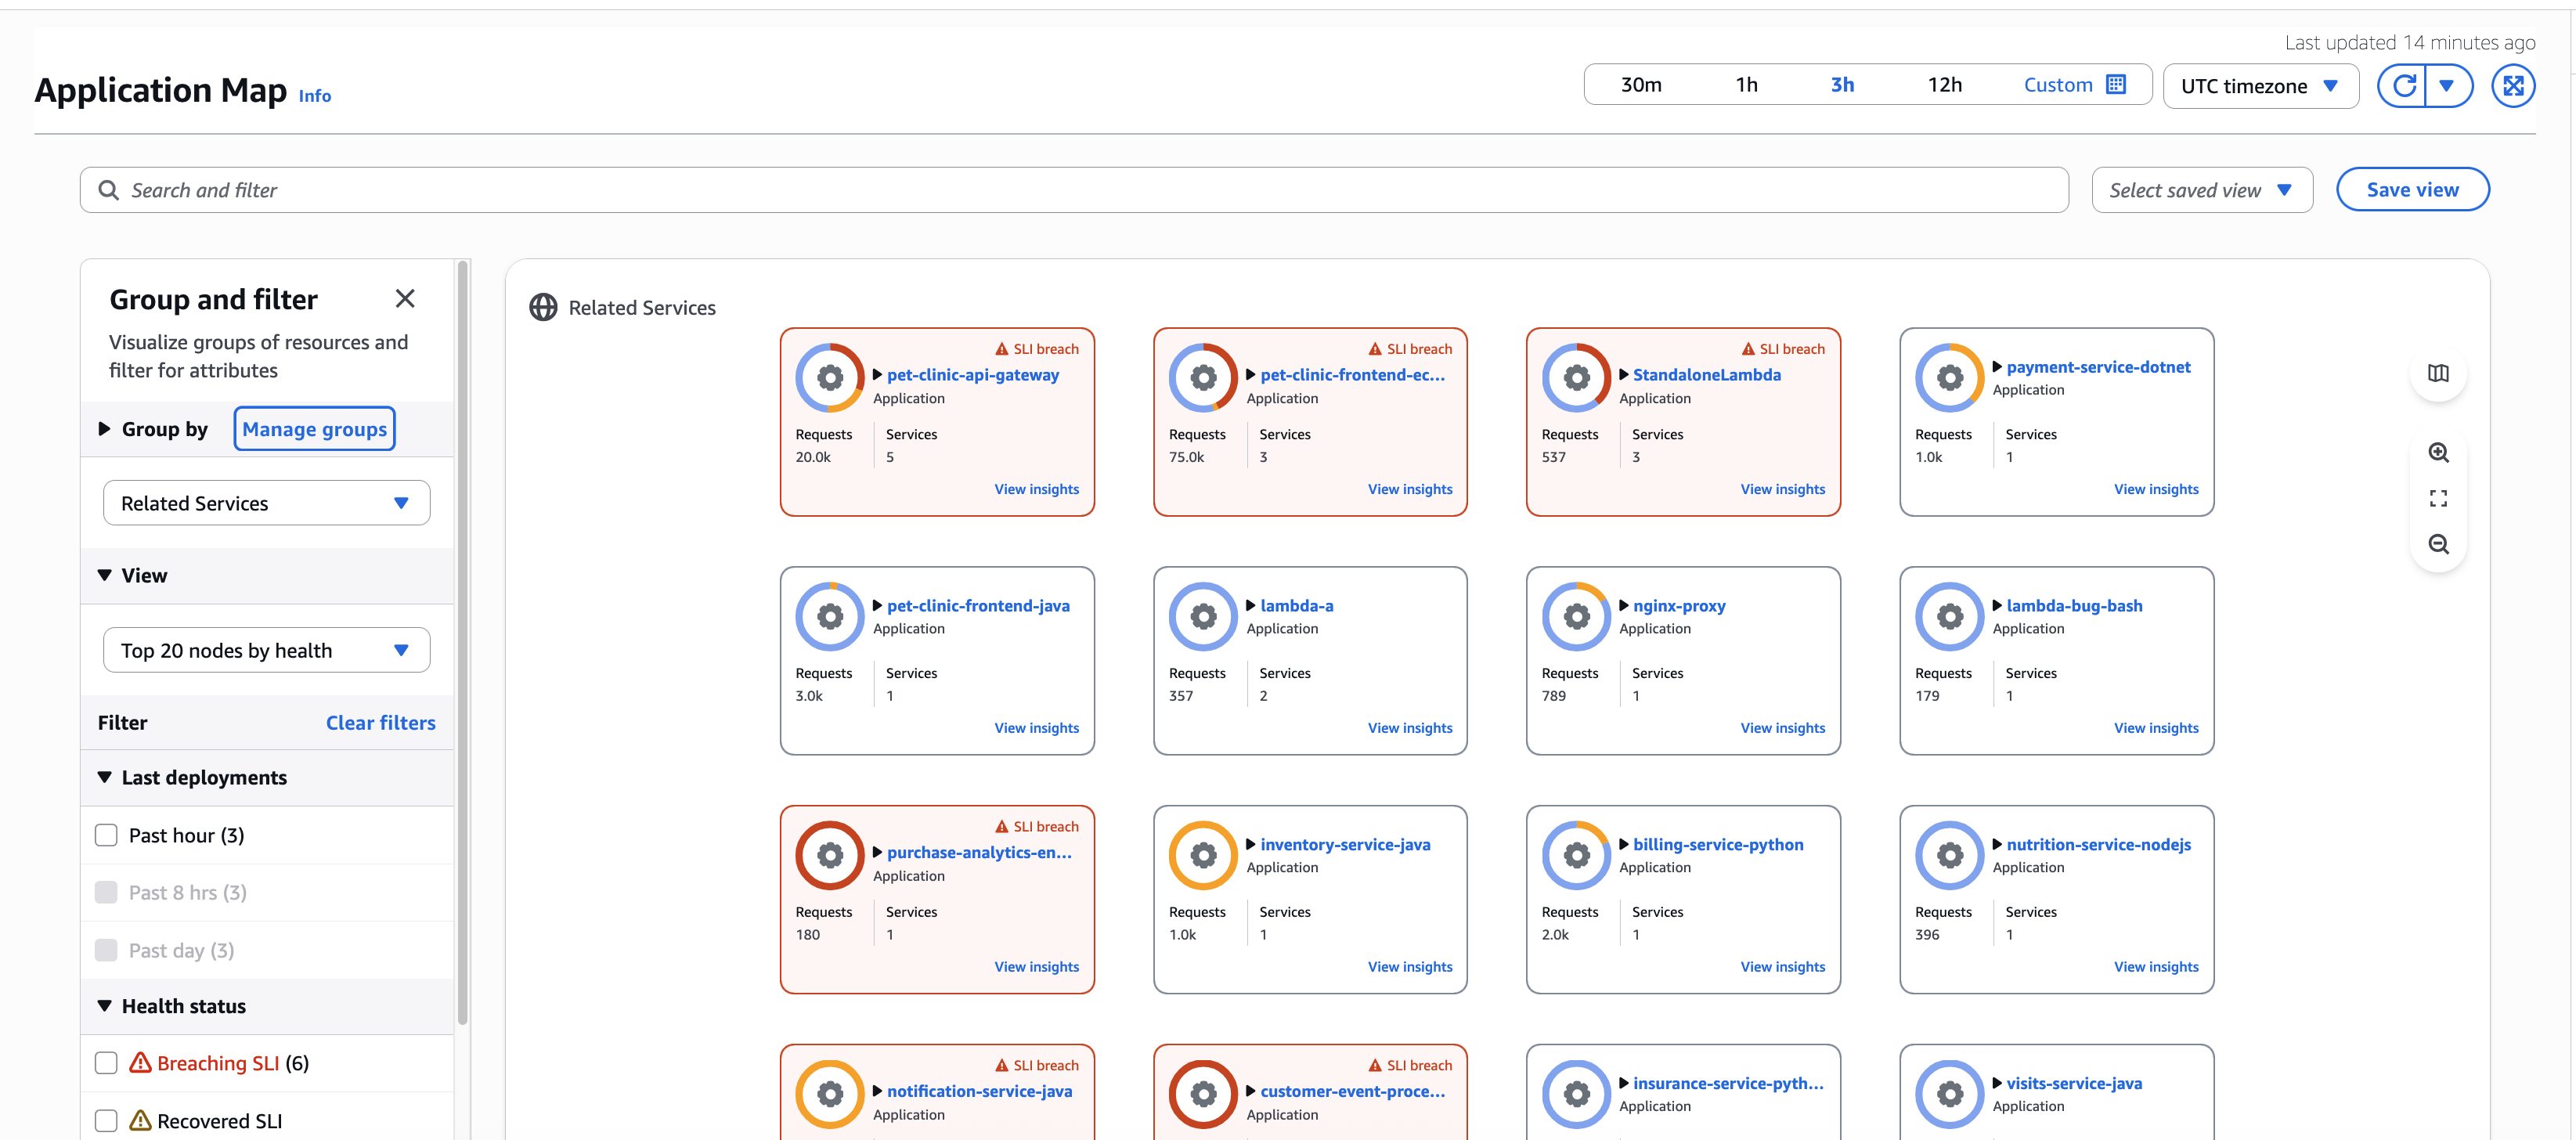
If new services have been deployed or dependencies have changed, open the Application Map to inspect your application topology. See a map of your applications that shows the relationship between clients, Synthetics canaries, services, and dependencies. Quickly see SLI health, view key metrics such as call volume, fault rate, and latency, and drill down to see more detailed information in the Service detail page.
Using Application Signals incurs charges. For information about CloudWatch pricing, see Amazon CloudWatch Pricing
. Note
It is not necessary to enable Application Signals to use CloudWatch Synthetics, or CloudWatch RUM. However, Synthetics and CloudWatch RUM work with Application Signals to provide benefits when you use these features together.
-
Application Signals cross-account – With Application Signals cross-account observability, you can monitor and troubleshoot your applications that span multiple Amazon accounts within a single Region.
You can use Amazon CloudWatch Observability Access Manager to set up one or more of your Amazon accounts as a monitoring account. You’ll provide the monitoring account with the ability to view data in your source account by creating a sink in your monitoring account. You use the sink to create a link from your source account to your monitoring account. For more information, see CloudWatch cross-account observability.
For proper functionality of Application Signals cross-account observability, ensure that the following telemetry types are shared through the CloudWatch Observability Access Manager.
-
Application Signals services and service level objectives (SLOs)
-
Metrics in Amazon CloudWatch
-
Log groups in Amazon CloudWatch Logs
-
Traces in Amazon X-Ray
-
Dynamic service grouping and filtering – Group and filter services with Application Signals' dynamic grouping capabilities. Automatically aggregate metrics and SLIs of services within groups, allowing you to start from a group view and dive deep into specific problematic areas. Application Signals provides two default groupings: "Environment" grouping that organizes by service environment, and "Related services" grouping that groups services based on their dependencies. For example, in Related services grouping, if Service A calls Service B, which calls Service C, they're grouped under Service A. Beyond default groupings, create custom groups by selecting services that align with your organizational needs, such as Business unit or Team.
Create custom groupings using Amazon tags or OpenTelemetry attributes that align with your team structure, business domains, or operational requirements. Custom groupings enable you to organize services according to your specific monitoring and troubleshooting workflows. For more information, see Configuring custom groups.
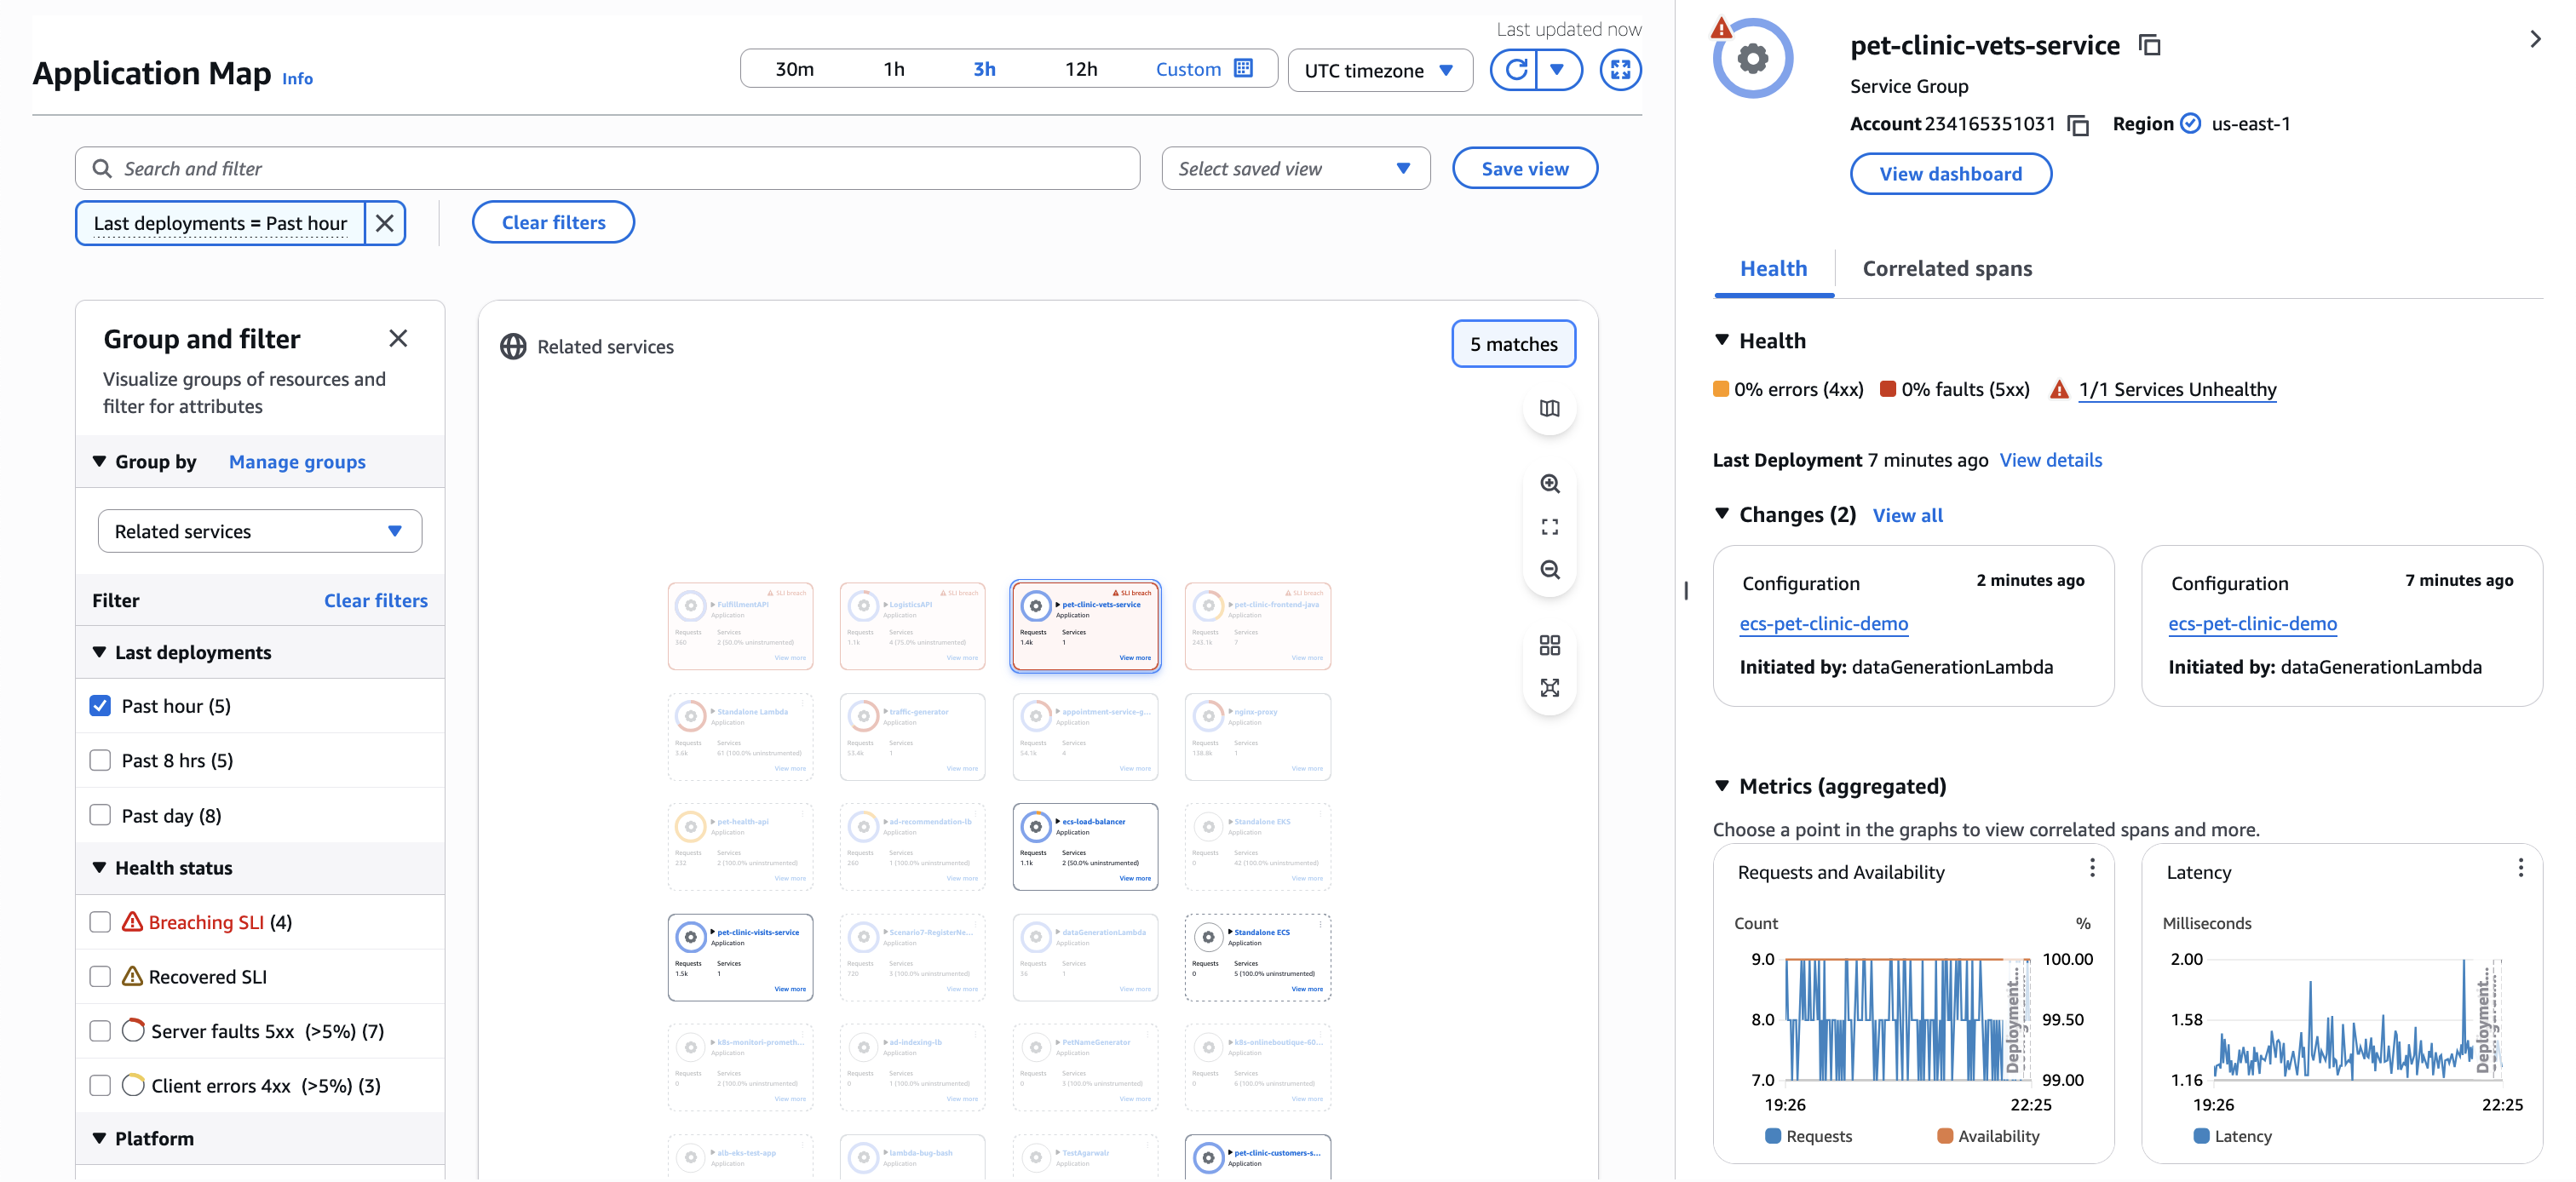
Change Events – Track change events across your application with Application Signals' automatic processing of CloudTrail events. Monitor configuration and deployment events for services and their dependencies, providing immediate context for operational analysis and troubleshooting. Change event detection is enabled alongside service discovery enablement through the CloudWatch Console or StartDiscovery API. For Amazon EKS services, deployment detection requires that the Amazon EKS services are instrumented with the Application Signals instrumentation SDK.
Change events are supported for the following resources:
Autoscaling Group
EKS Cluster
EKS Workload (only deployments)
ECS Cluster and Service
ELB Load balancer and Target Group
Lambda Function
BedrockAgentCore Runtime and RuntimeEndpoint
Automated audit findings – Discover critical insights through Application Signals' automated audit findings. The service analyzes your applications to report significant observations and potential problems, simplifying root cause analysis. These automated findings consolidate relevant traces, eliminating the need to navigate through multiple clicks. The audit system helps teams quickly identify issues and their underlying causes, enabling faster problem resolution.
Application Signals employs advanced analytics to detect patterns, highlight resource inefficiencies, and suggest optimization opportunities. Findings are prioritized based on severity and potential business impact, enabling teams to focus on the most critical issues first. Get actionable recommendations for improving service reliability and performance without manual analysis.