View your application topology and monitor operational health with the CloudWatch application map
Note
The CloudWatch application map replaces the Service Map. To see a map of your application based on Amazon X-Ray traces, open the X-Ray Trace Map. Choose Trace Map under the X-Ray section in the left navigation pane of the CloudWatch console.
After enabling your application for Application Signals, the application map displays nodes representing your groups. You then drill down in these groups to view your services and their dependencies.
Use the application map to view the topology of your application clients, synthetics canaries,
services and dependencies, and monitor operational health. To view the application map, open the
CloudWatch console
After you enable your application for Application Signals, use the application map to make it easier to monitor your application's operational health:
-
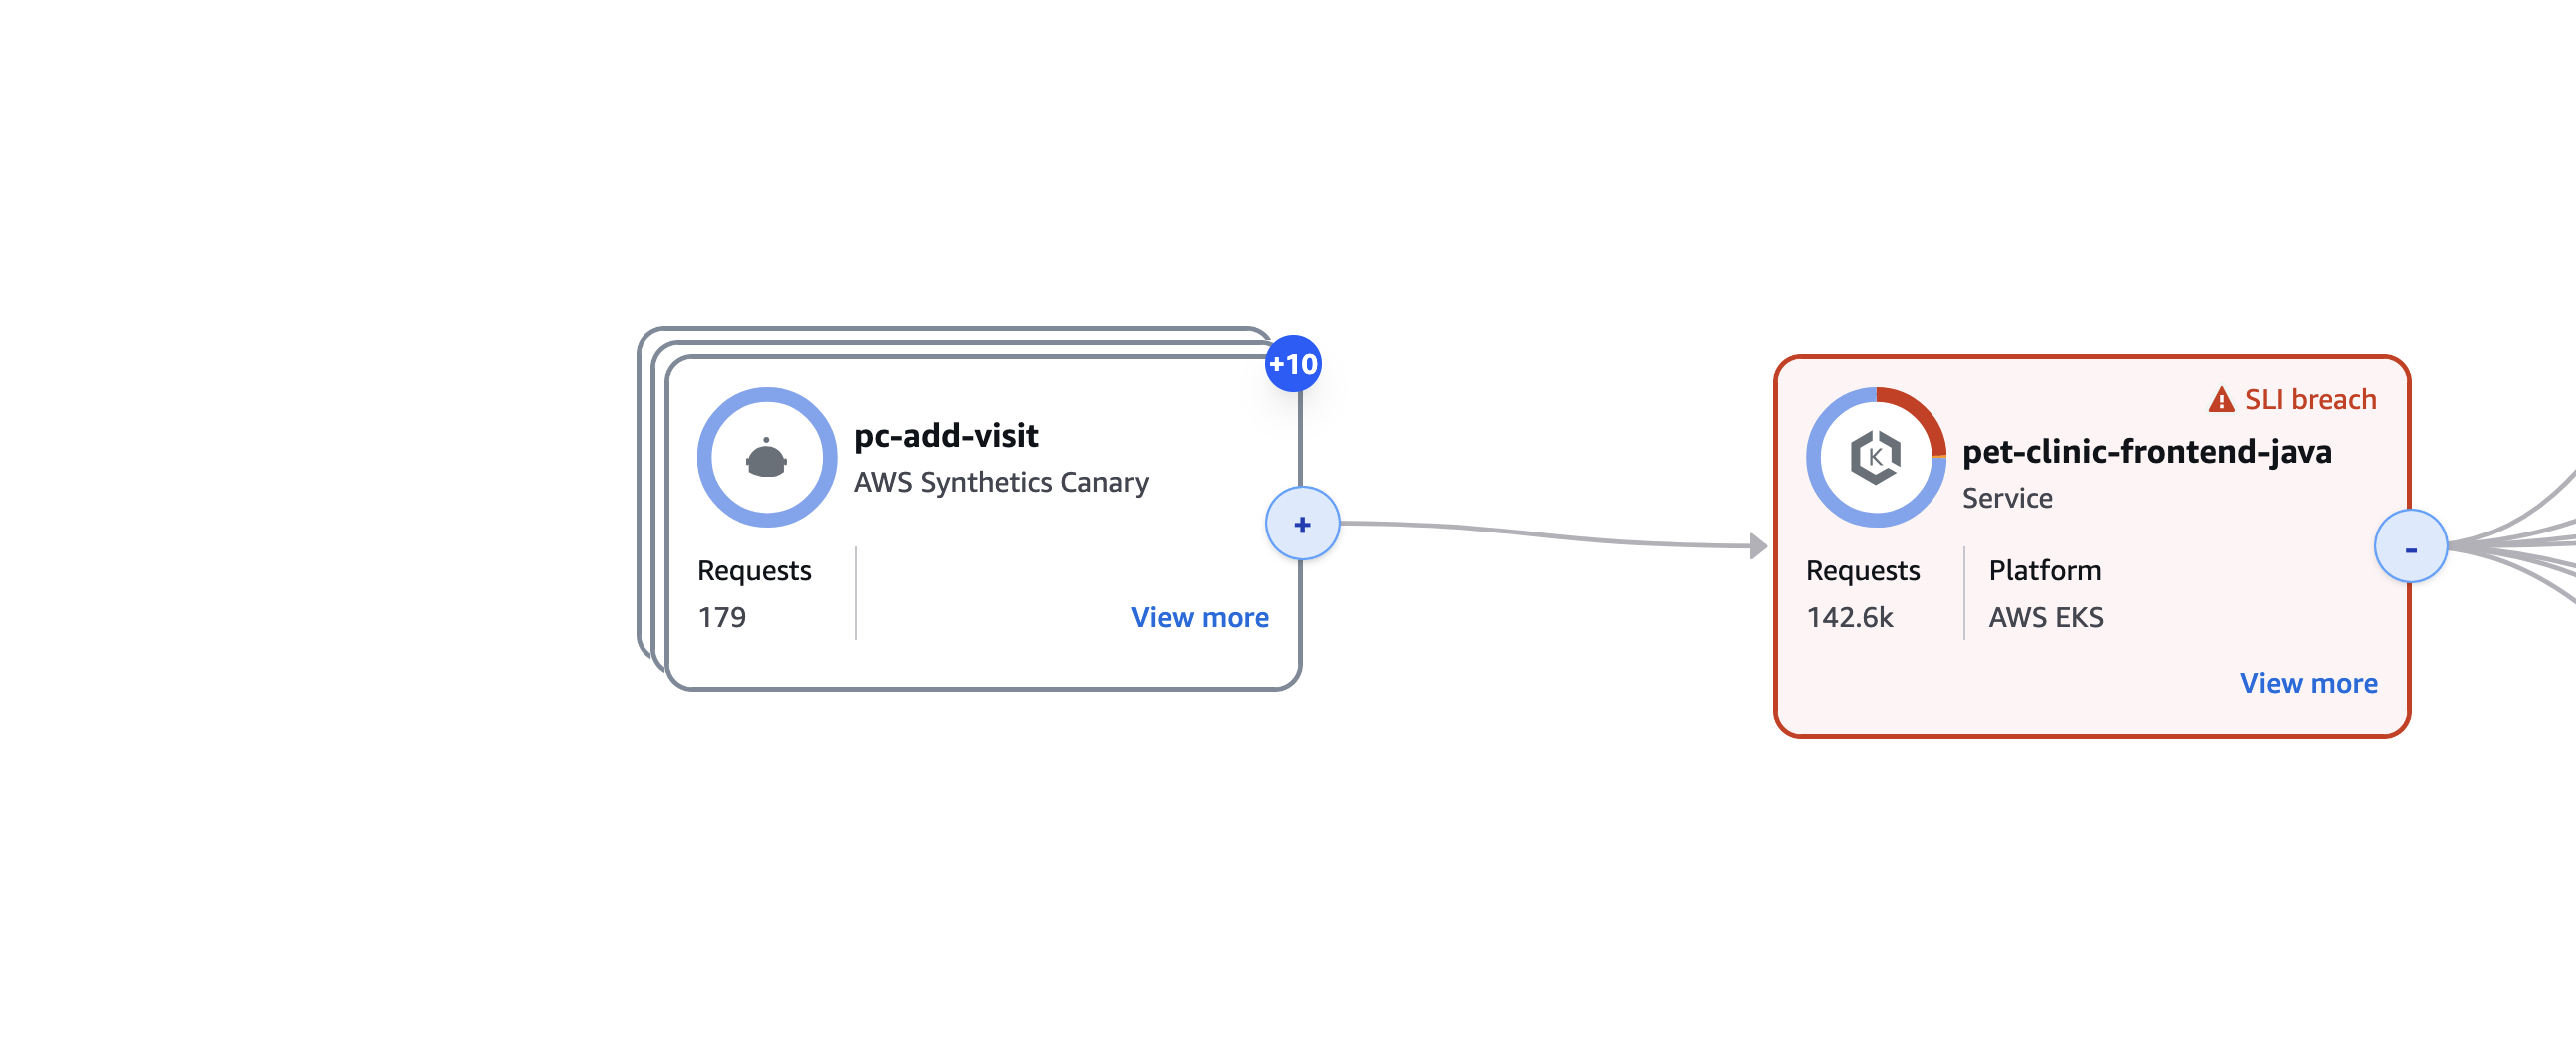
View connections between client, canary, service, and dependency nodes to help you understand your application topology and execution flow. This is especially helpful if your service operators are not your development team.
-
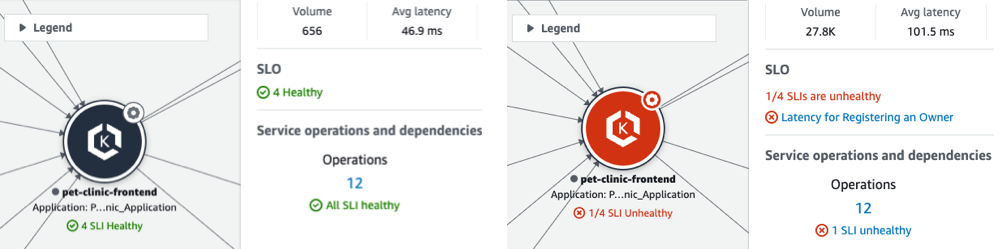
See which services are meeting or not meeting your service level objectives (SLOs). When a service is not meeting your SLOs, you can quickly identify whether a downstream service or dependency might be contributing to the issue or impacting multiple upstream services.
-
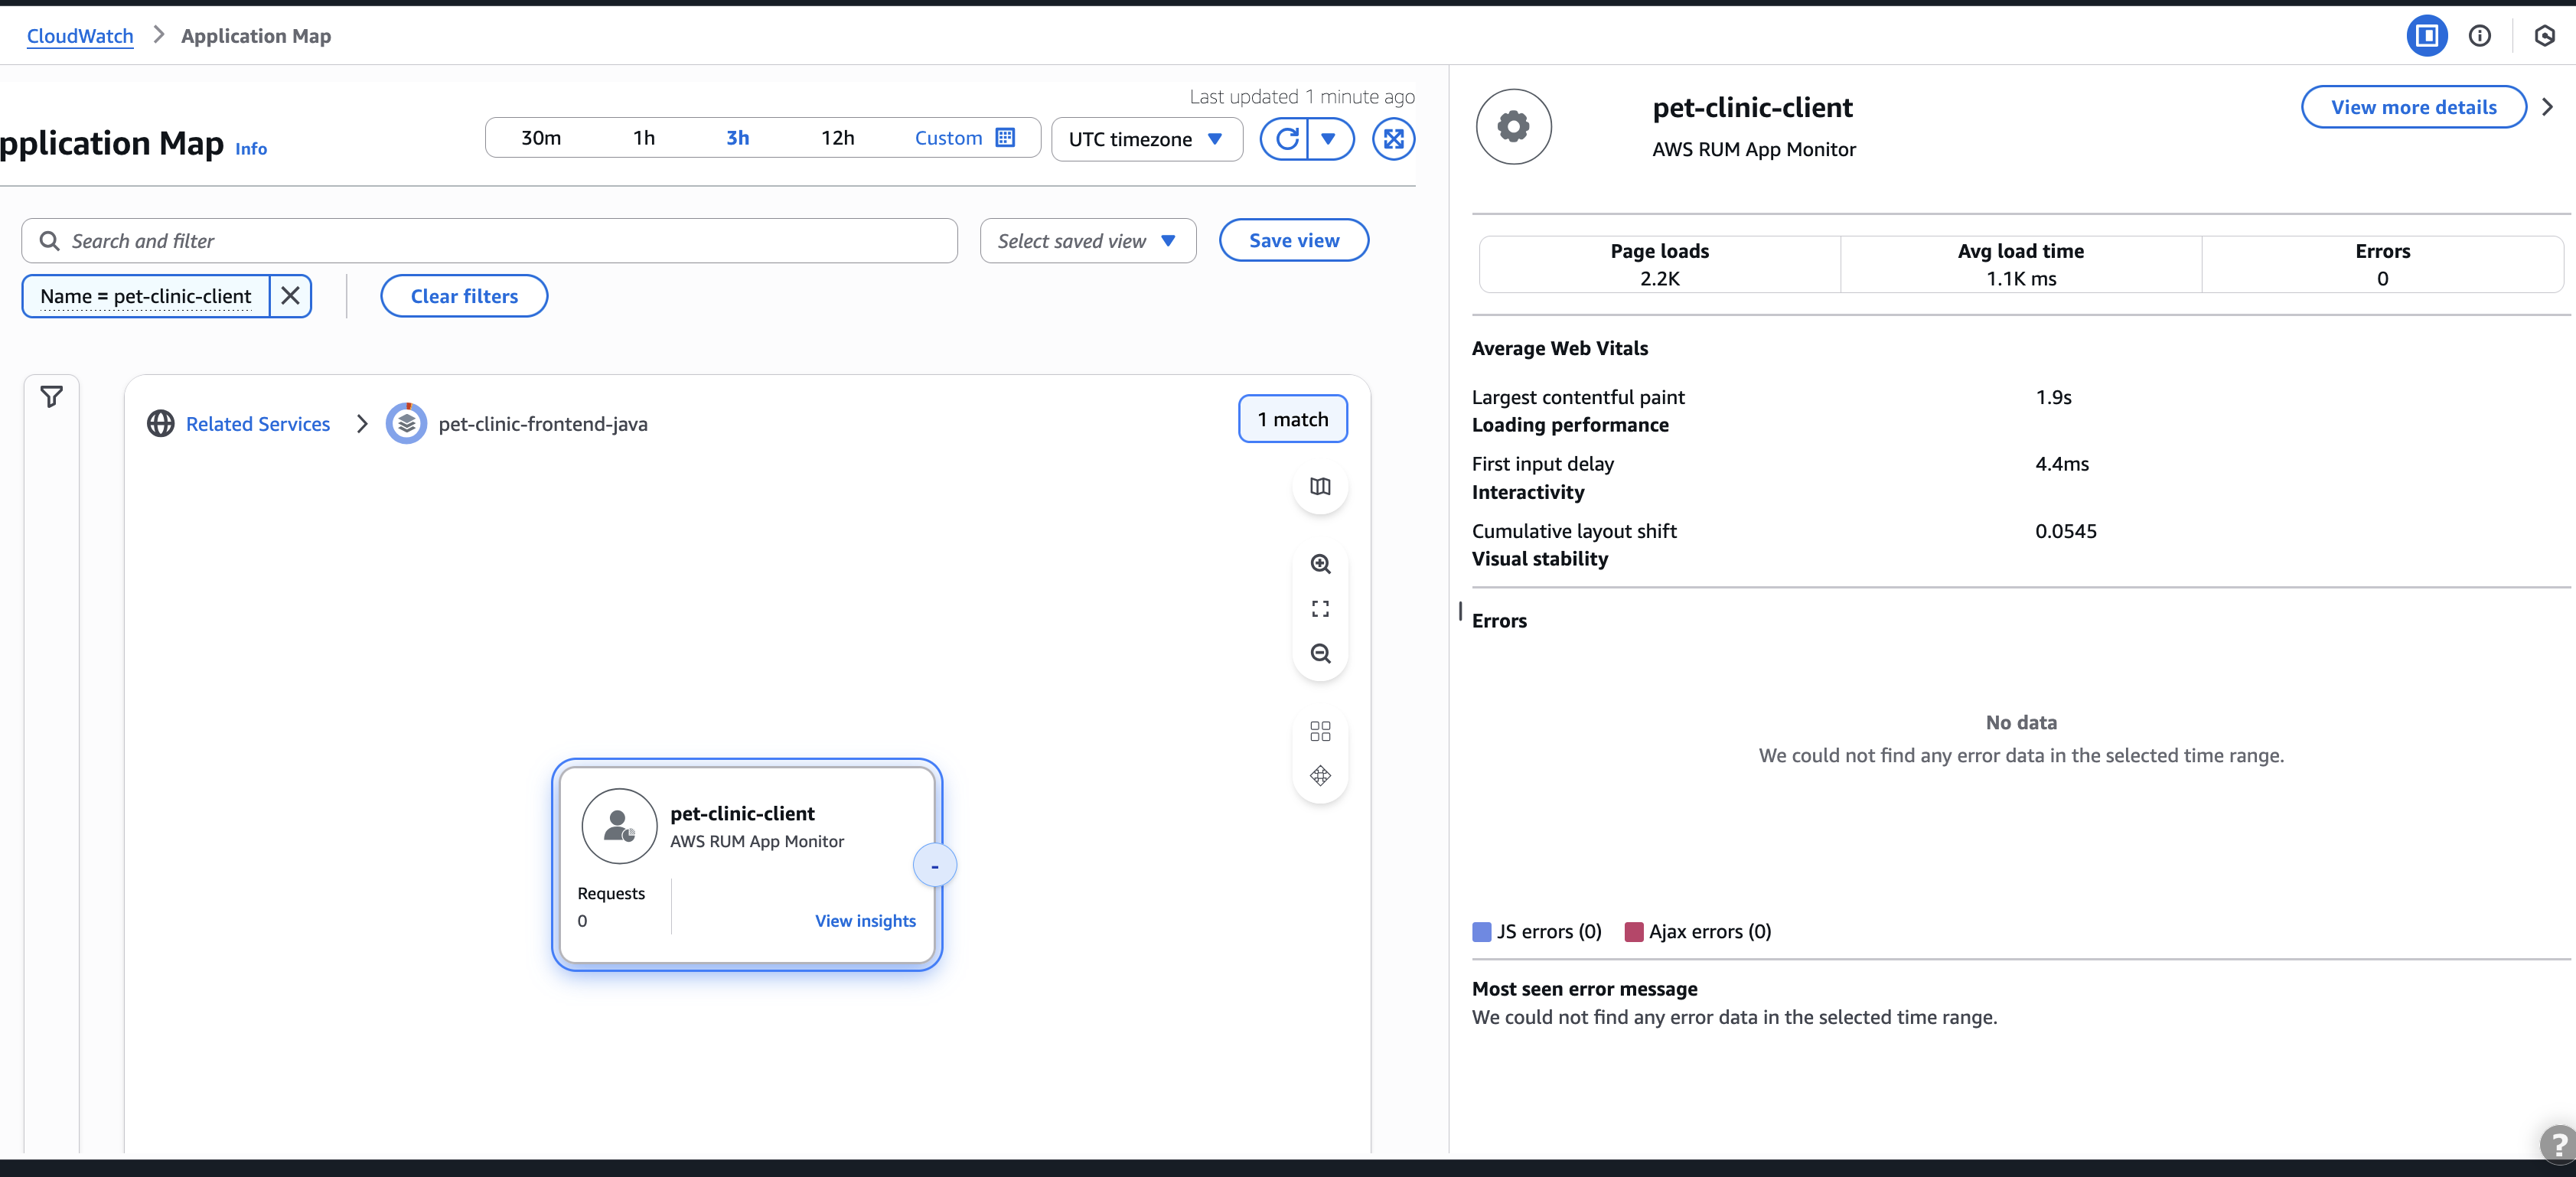
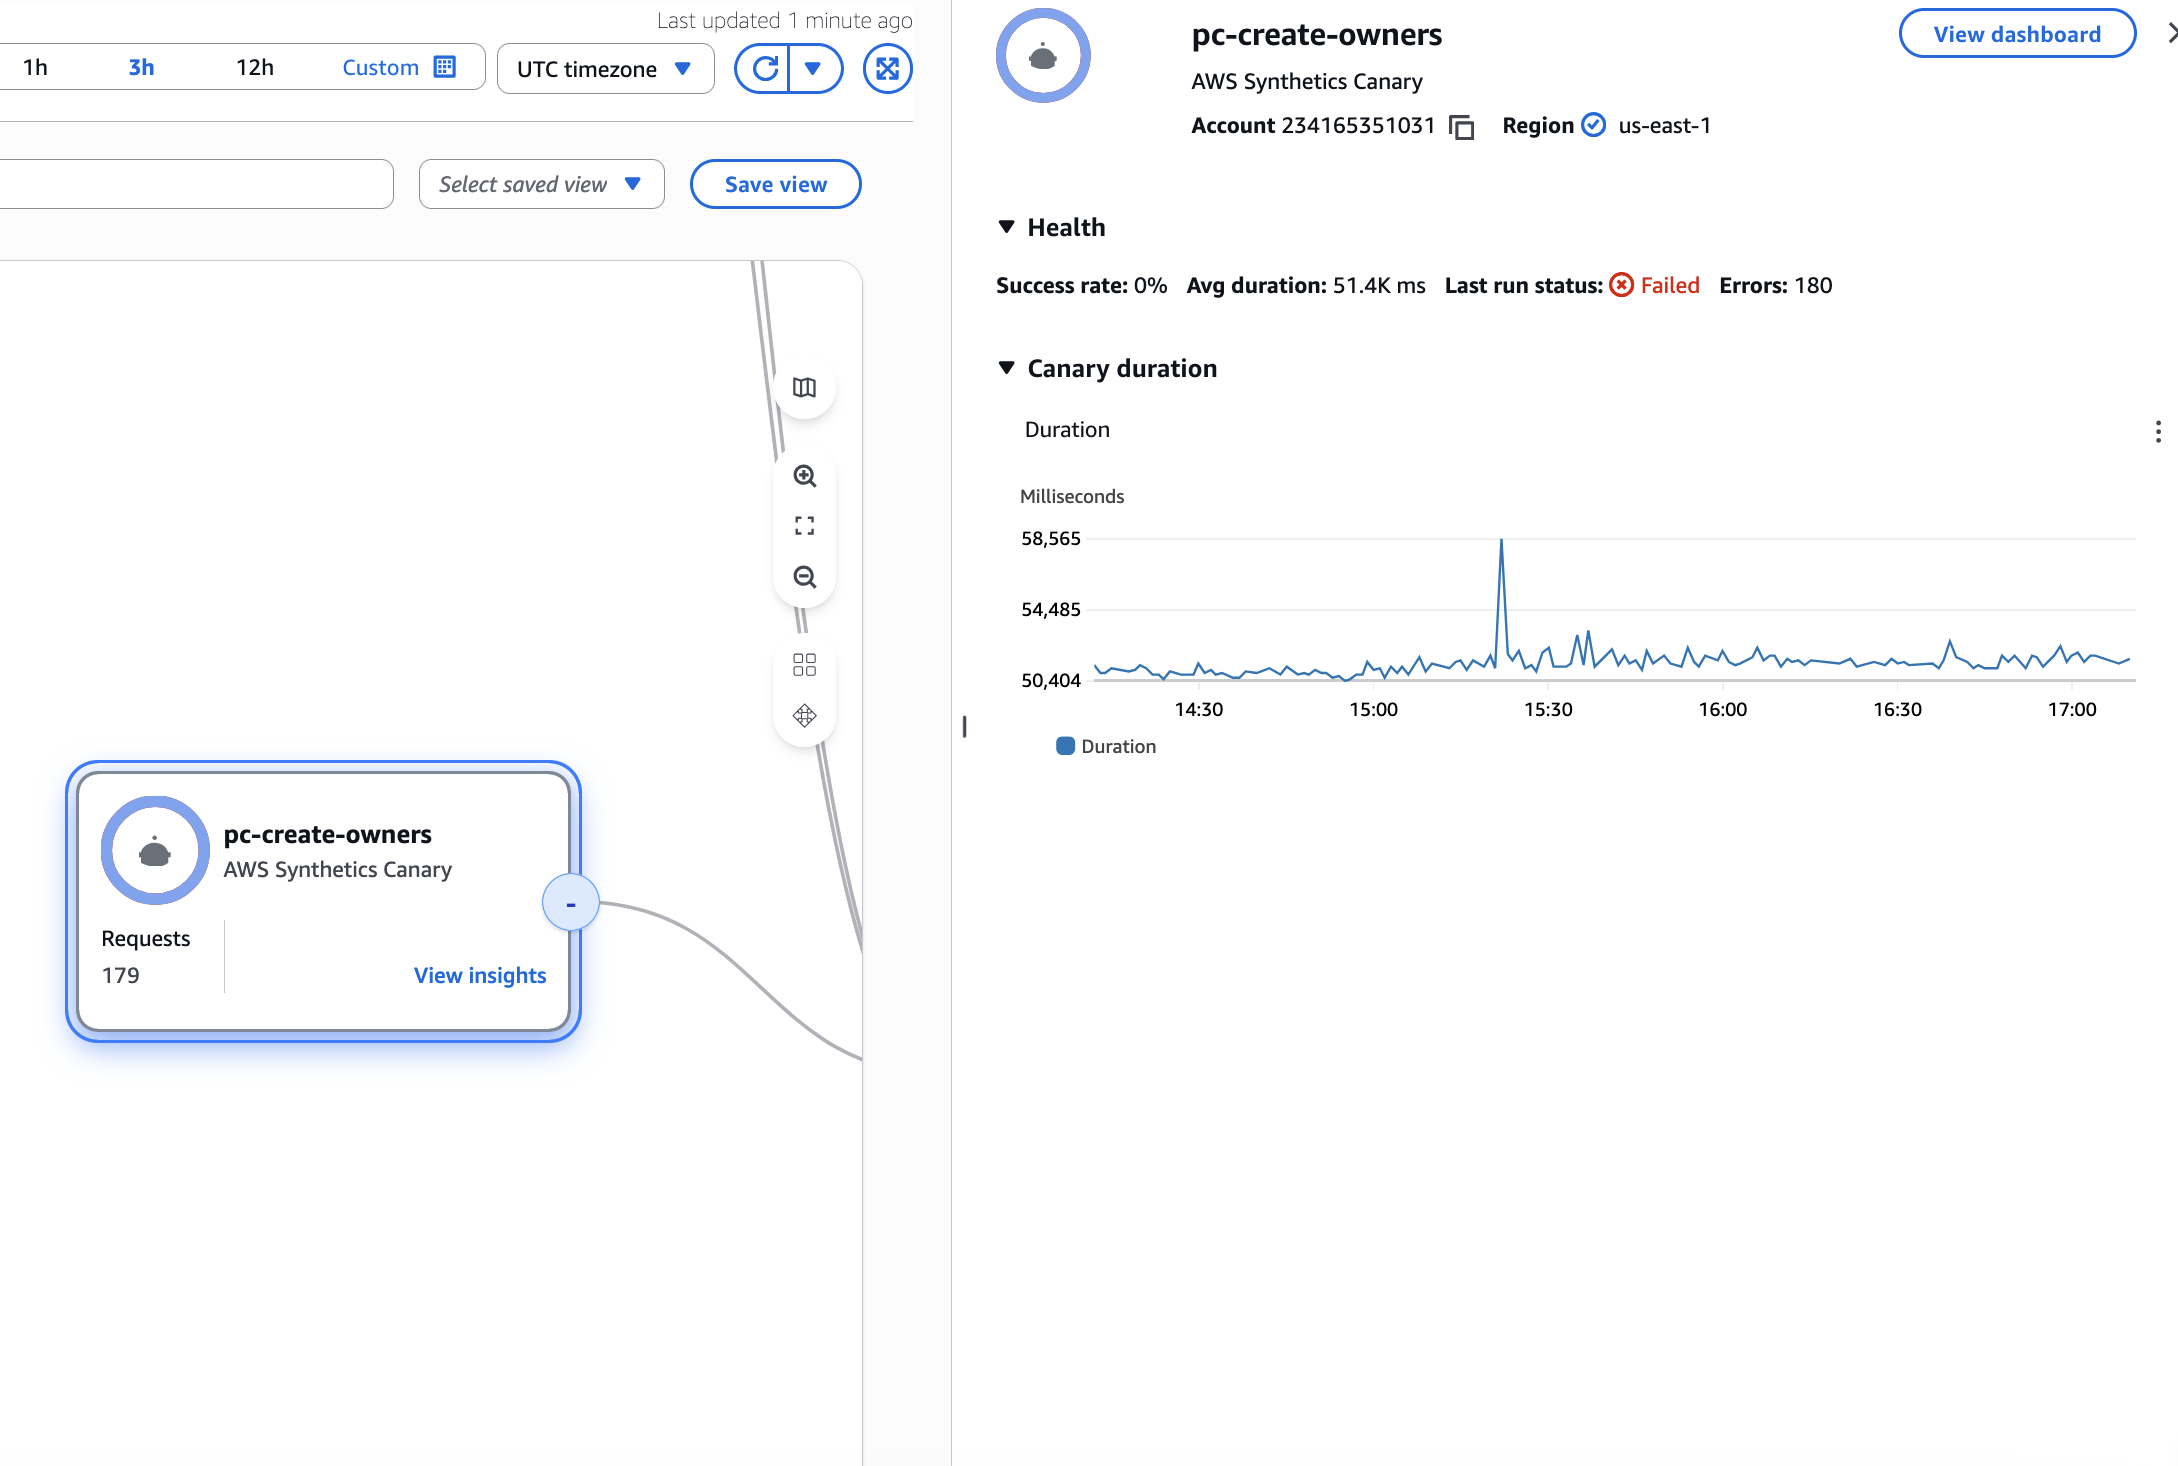
Select an individual client, synthetics canary, service, or dependency node to see related metrics. The Service details page shows more detailed information about operations, dependencies, synthetics canaries, and client pages.
-
Filter and zoom the application map to make it easier to focus on a part of your application topology, or see the entire map. Create a filter by choosing one or more properties from the filter text box. As you choose each property, you are guided through filter criteria. You will see the complete filter below the filter text box. Choose Clear filters at any time to remove the filter.
Monitor services across multiple Amazon accounts in a single unified application map. Services from different accounts are clearly identified with account information, enabling unified observability for distributed applications.
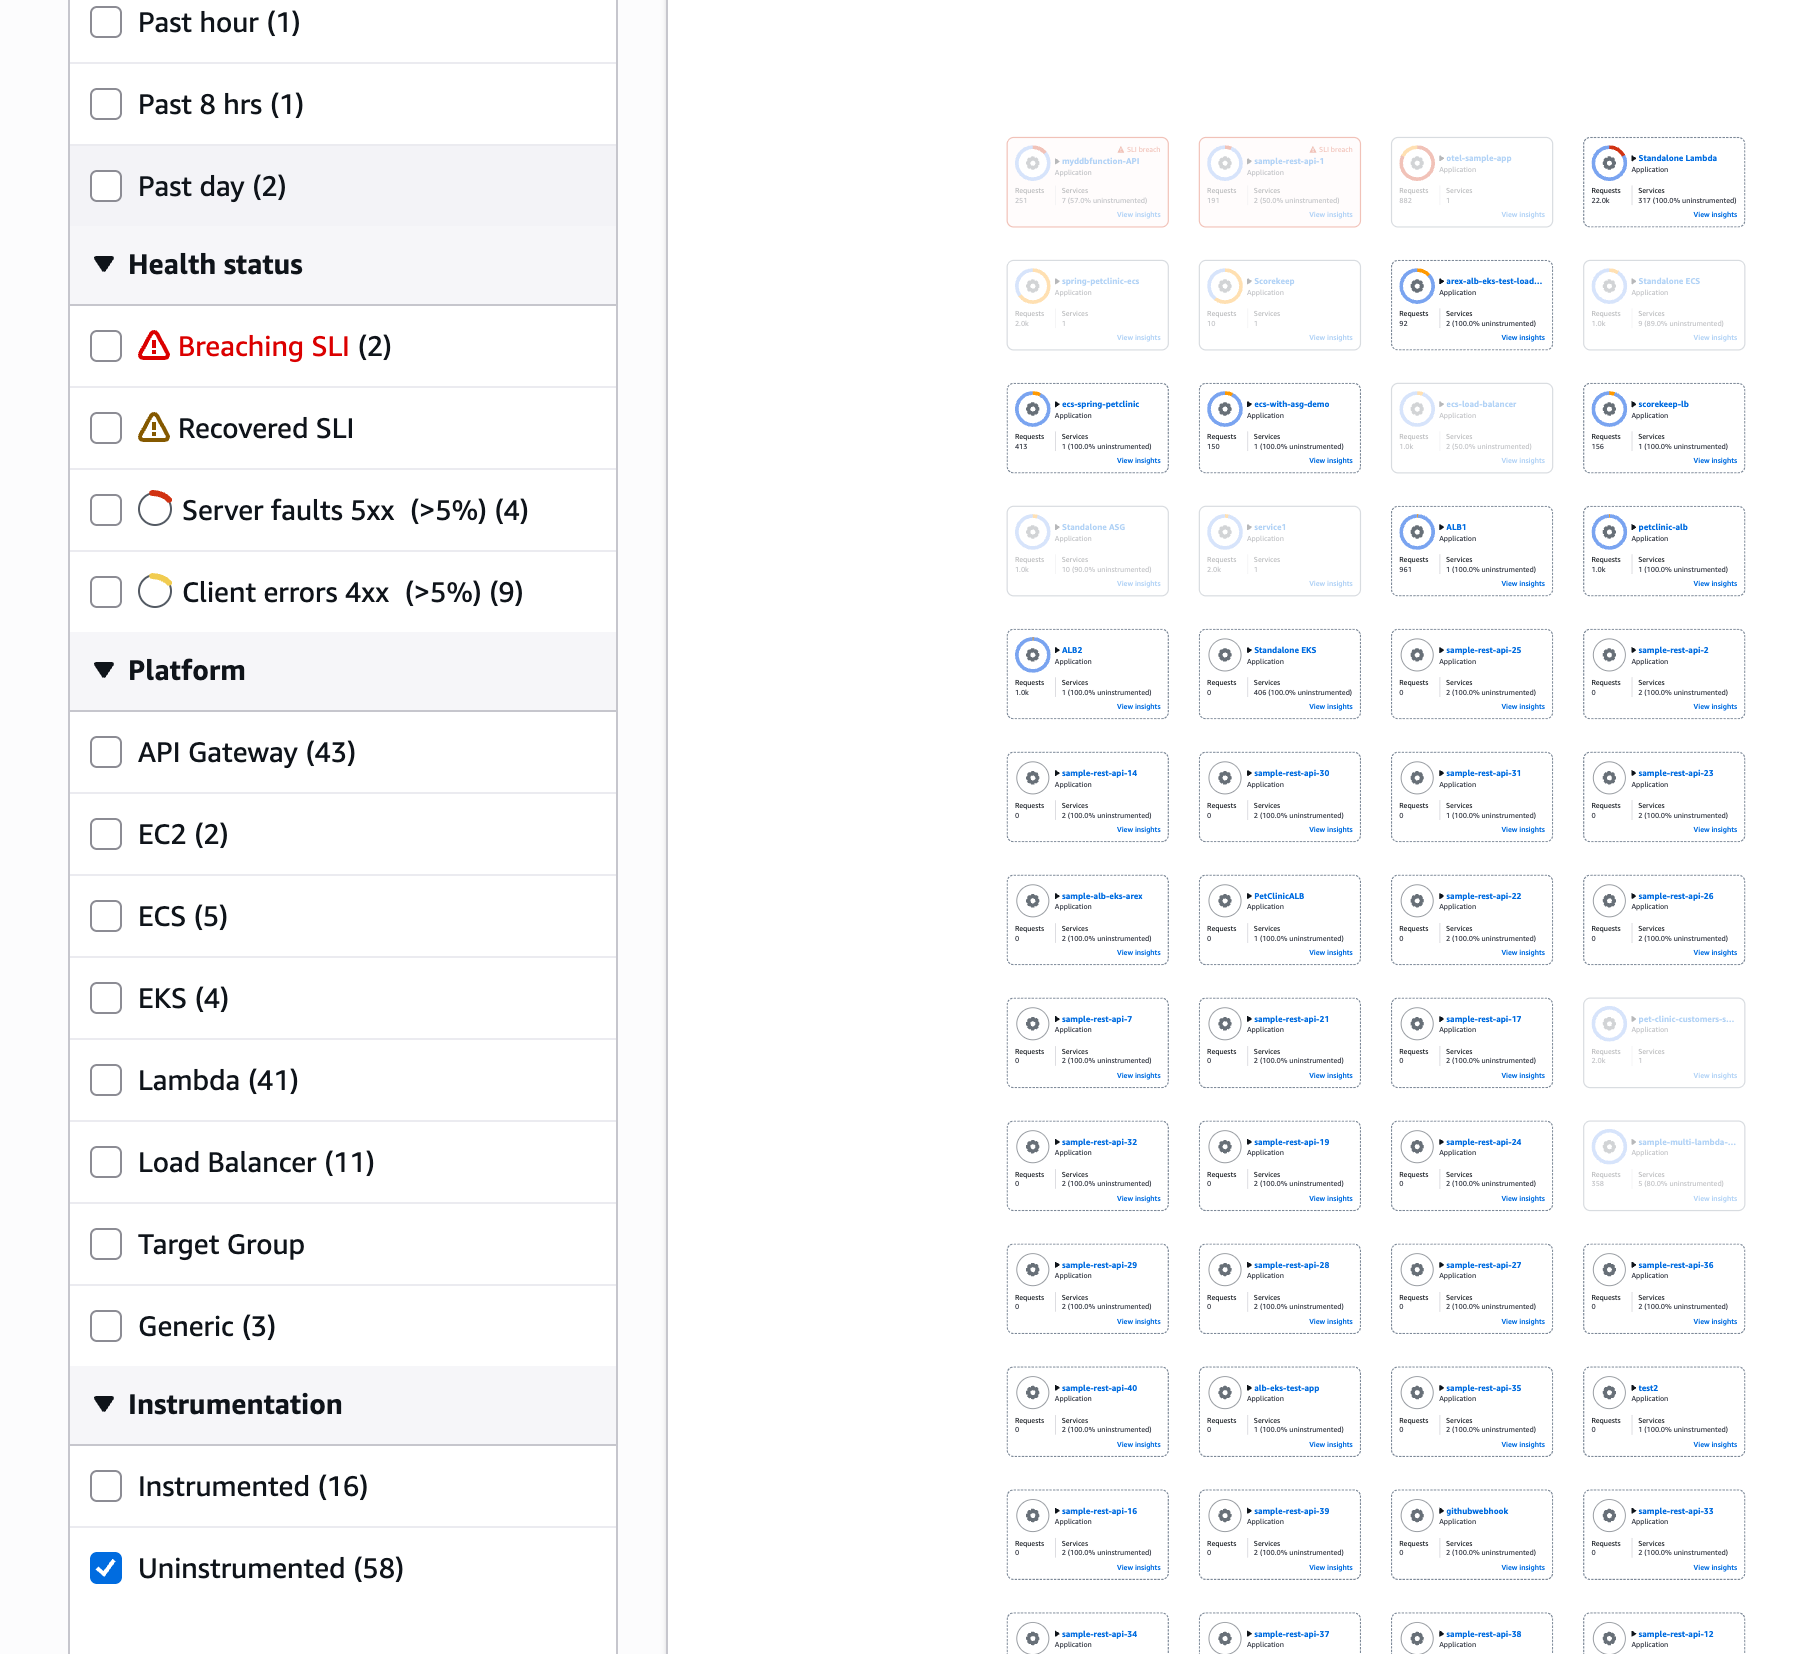
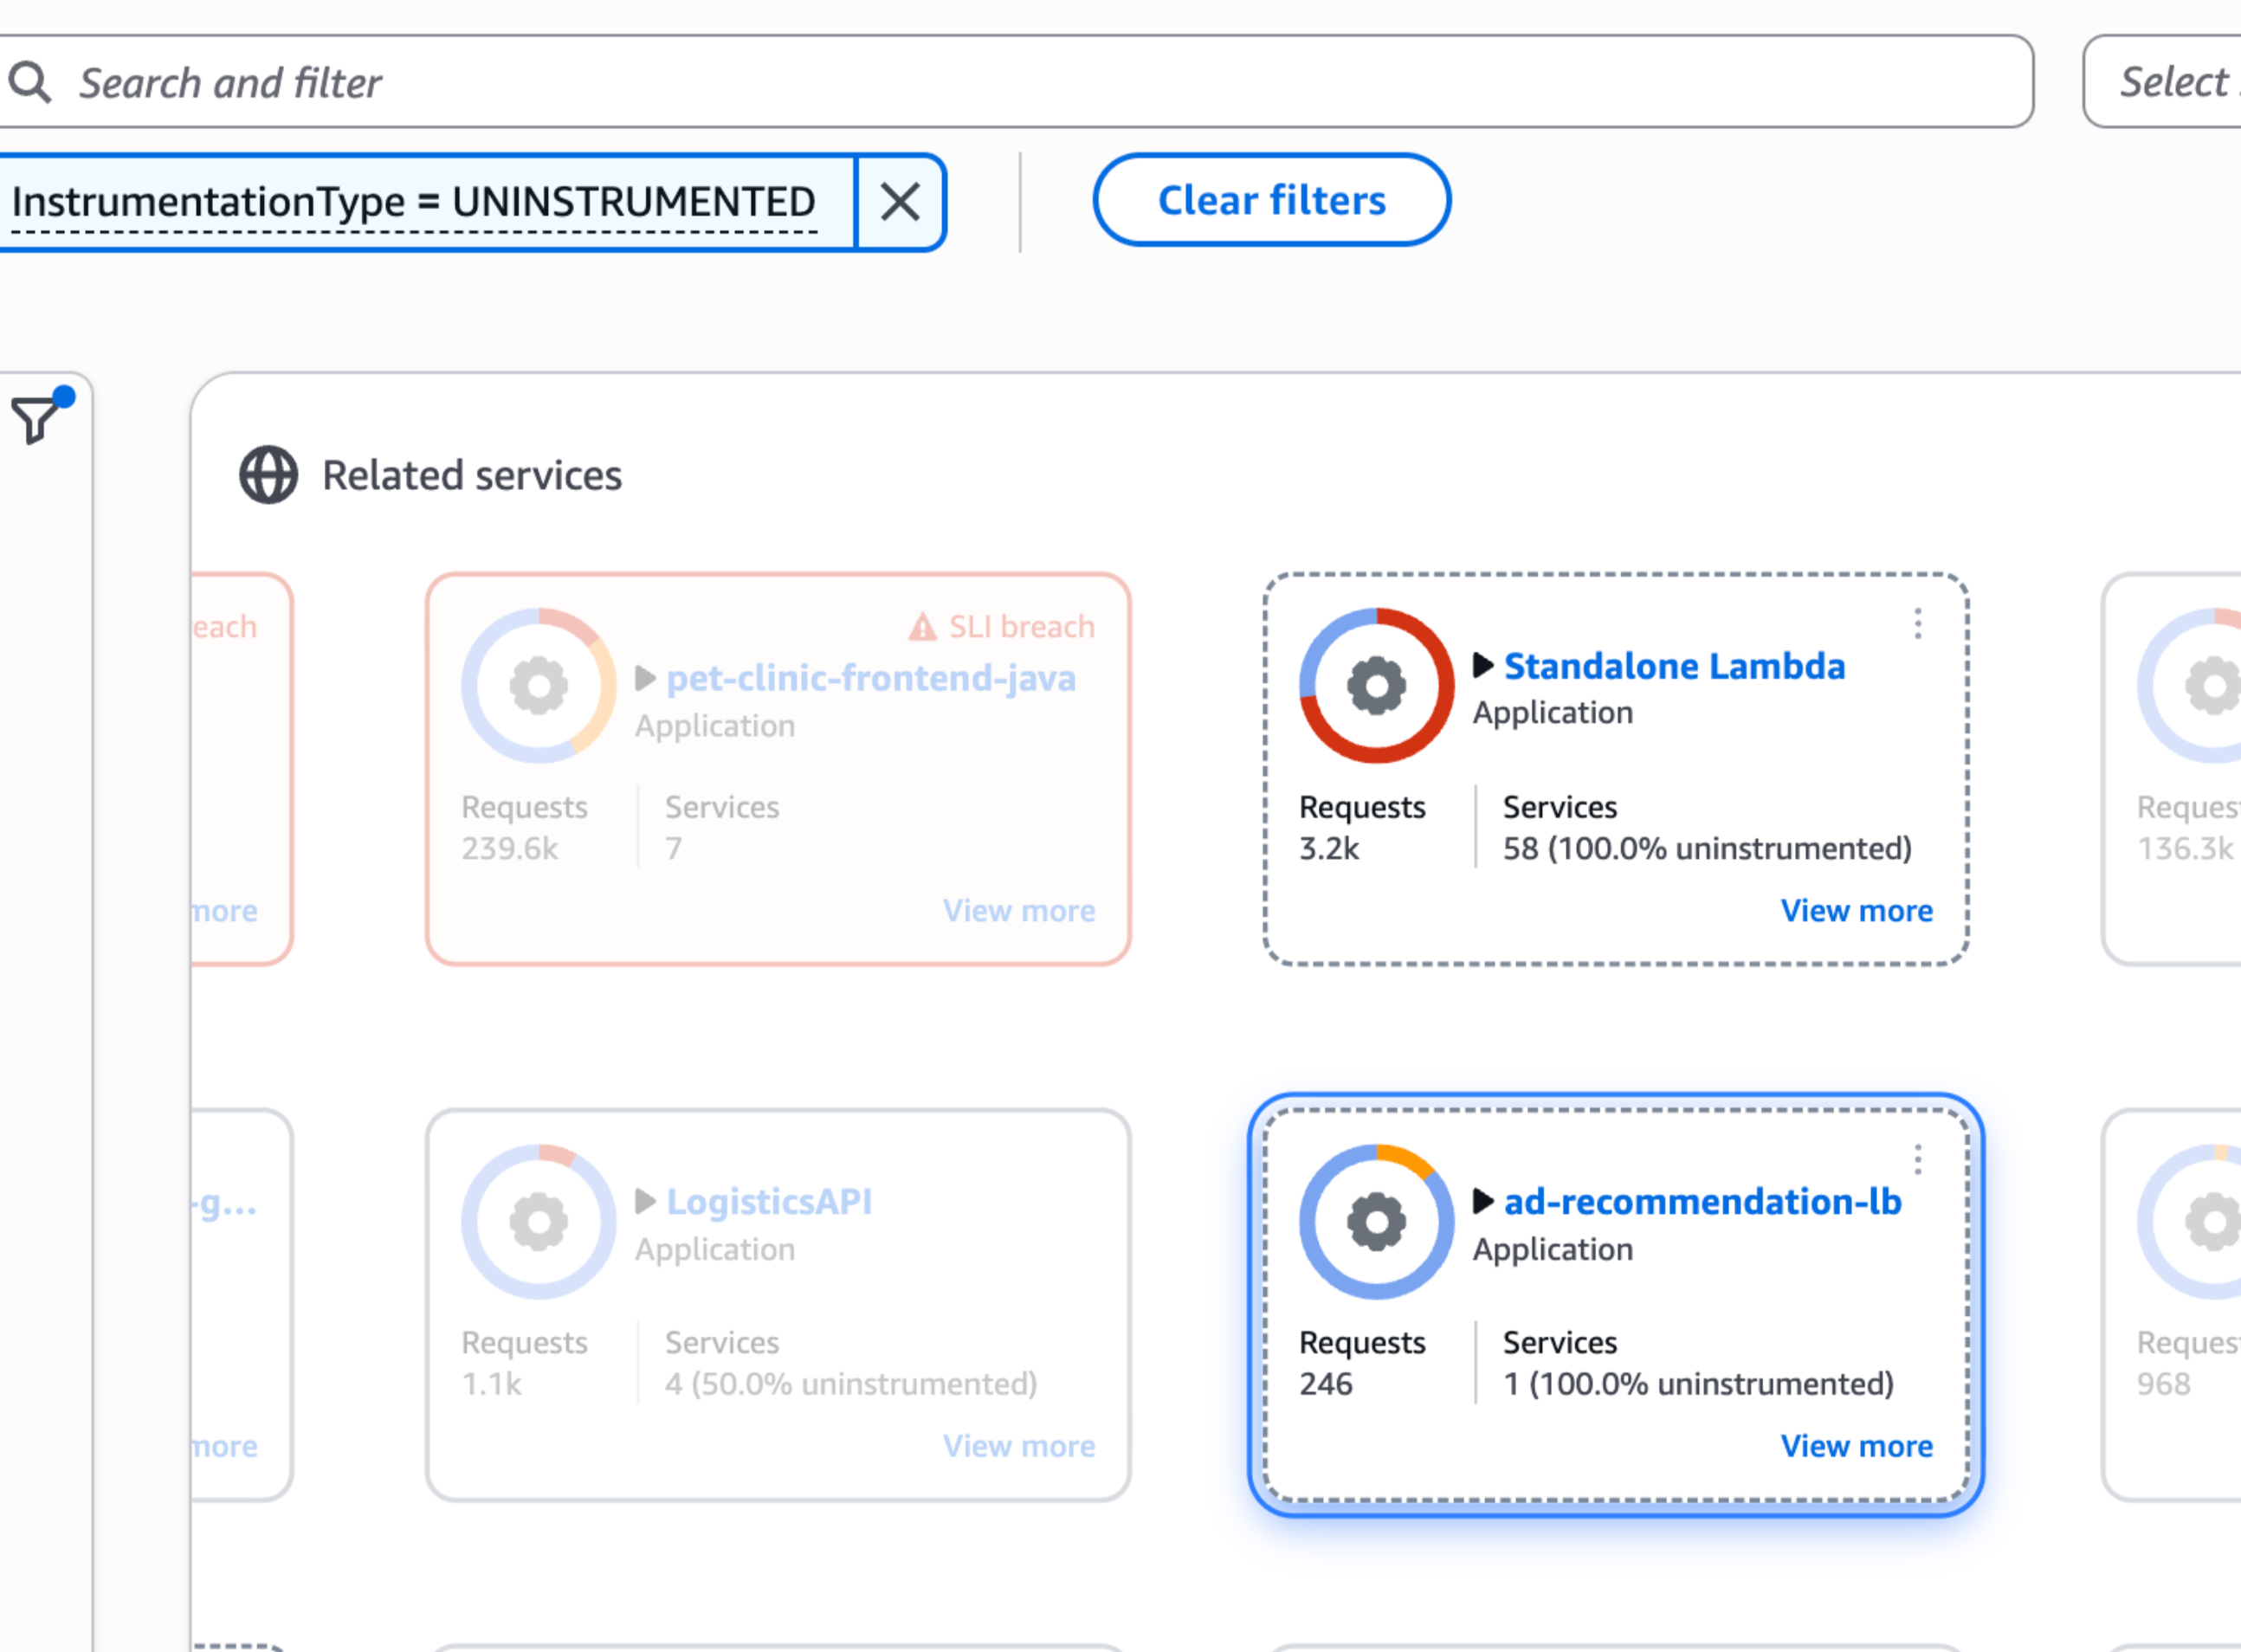
Identify services not yet instrumented in your application. Application Signals automatically detects and displays services that haven't been instrumented yet, helping you achieve complete observability coverage. Un-instrumented services are visually distinguished on the map to help you prioritize instrumentation efforts.
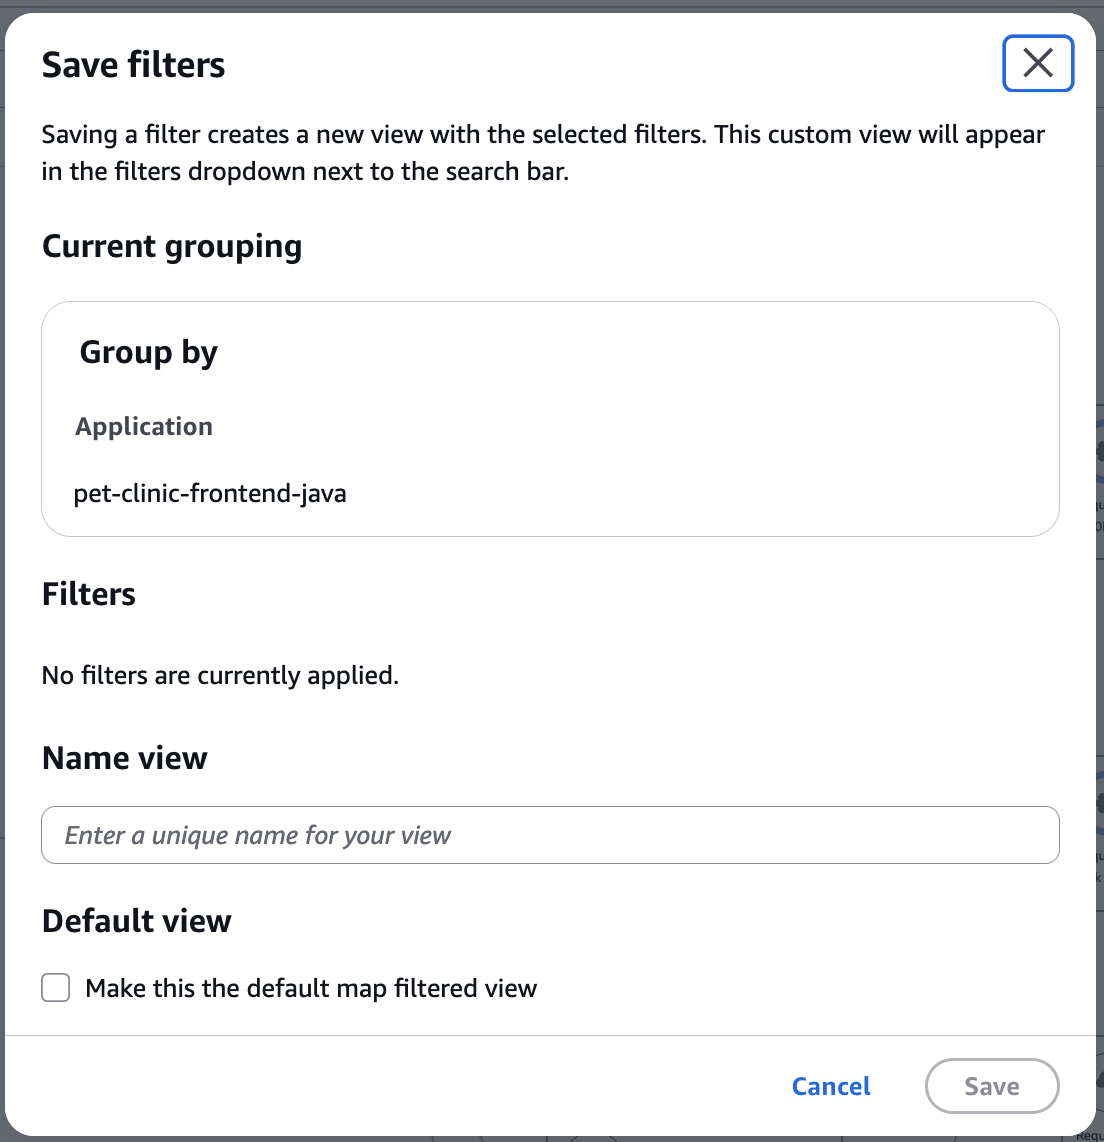
Group and filter services to create customized views that match your workflows. This organization helps you quickly find and access the services you use most frequently
Save your filtered and grouped views to quickly return to frequently used configurations
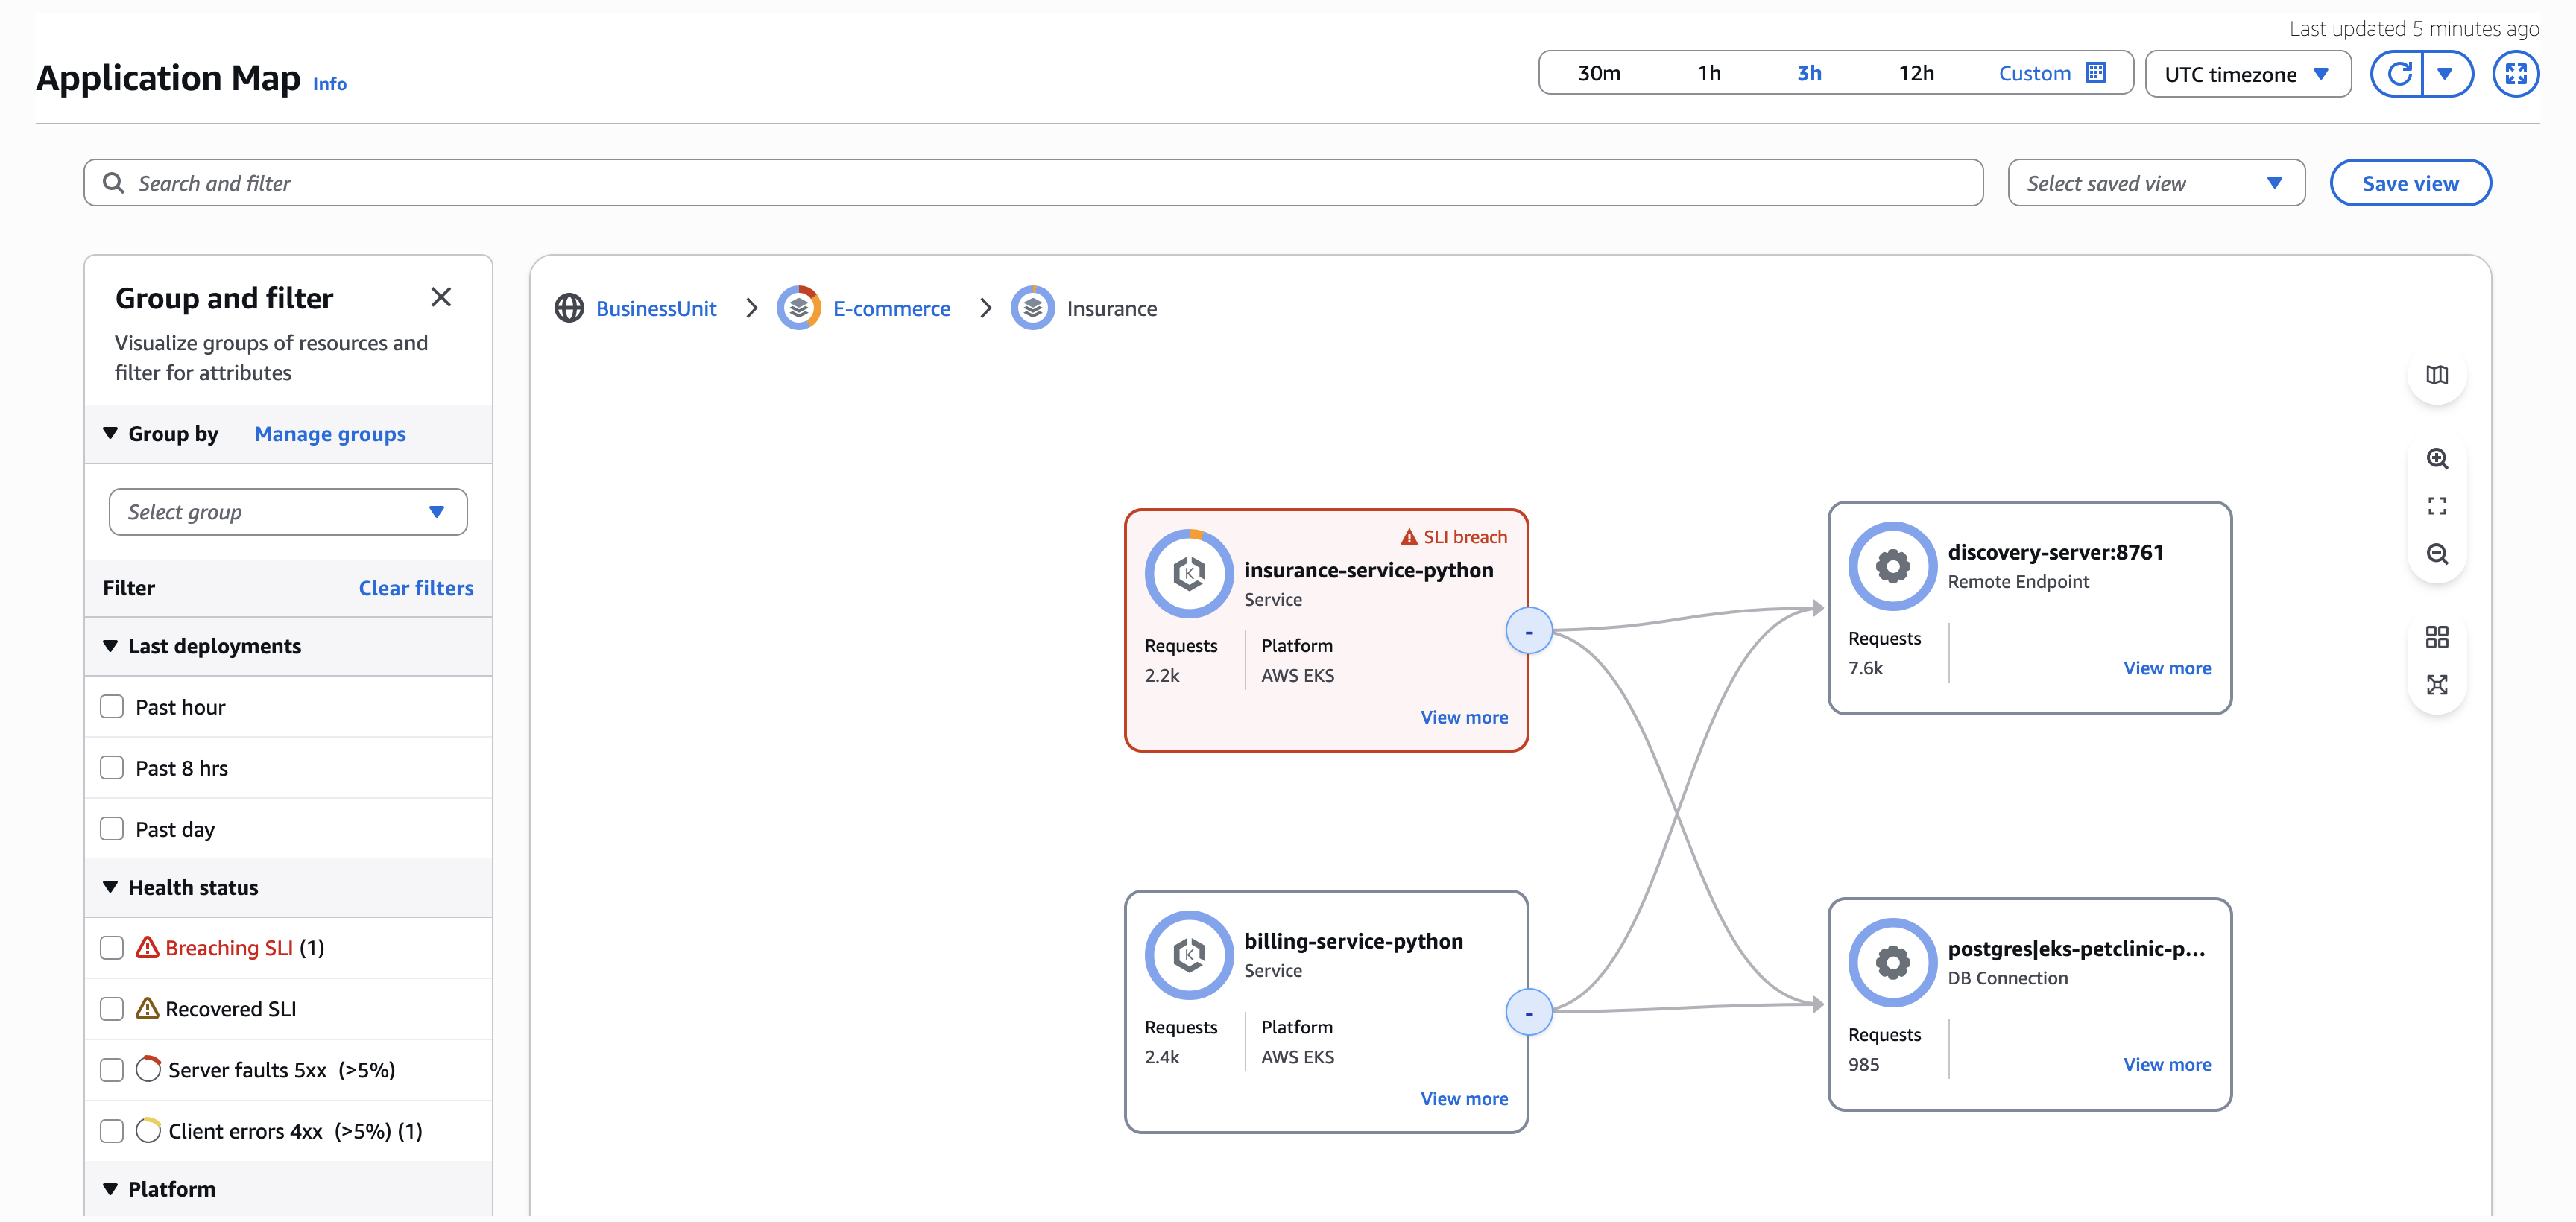
Explore the application map
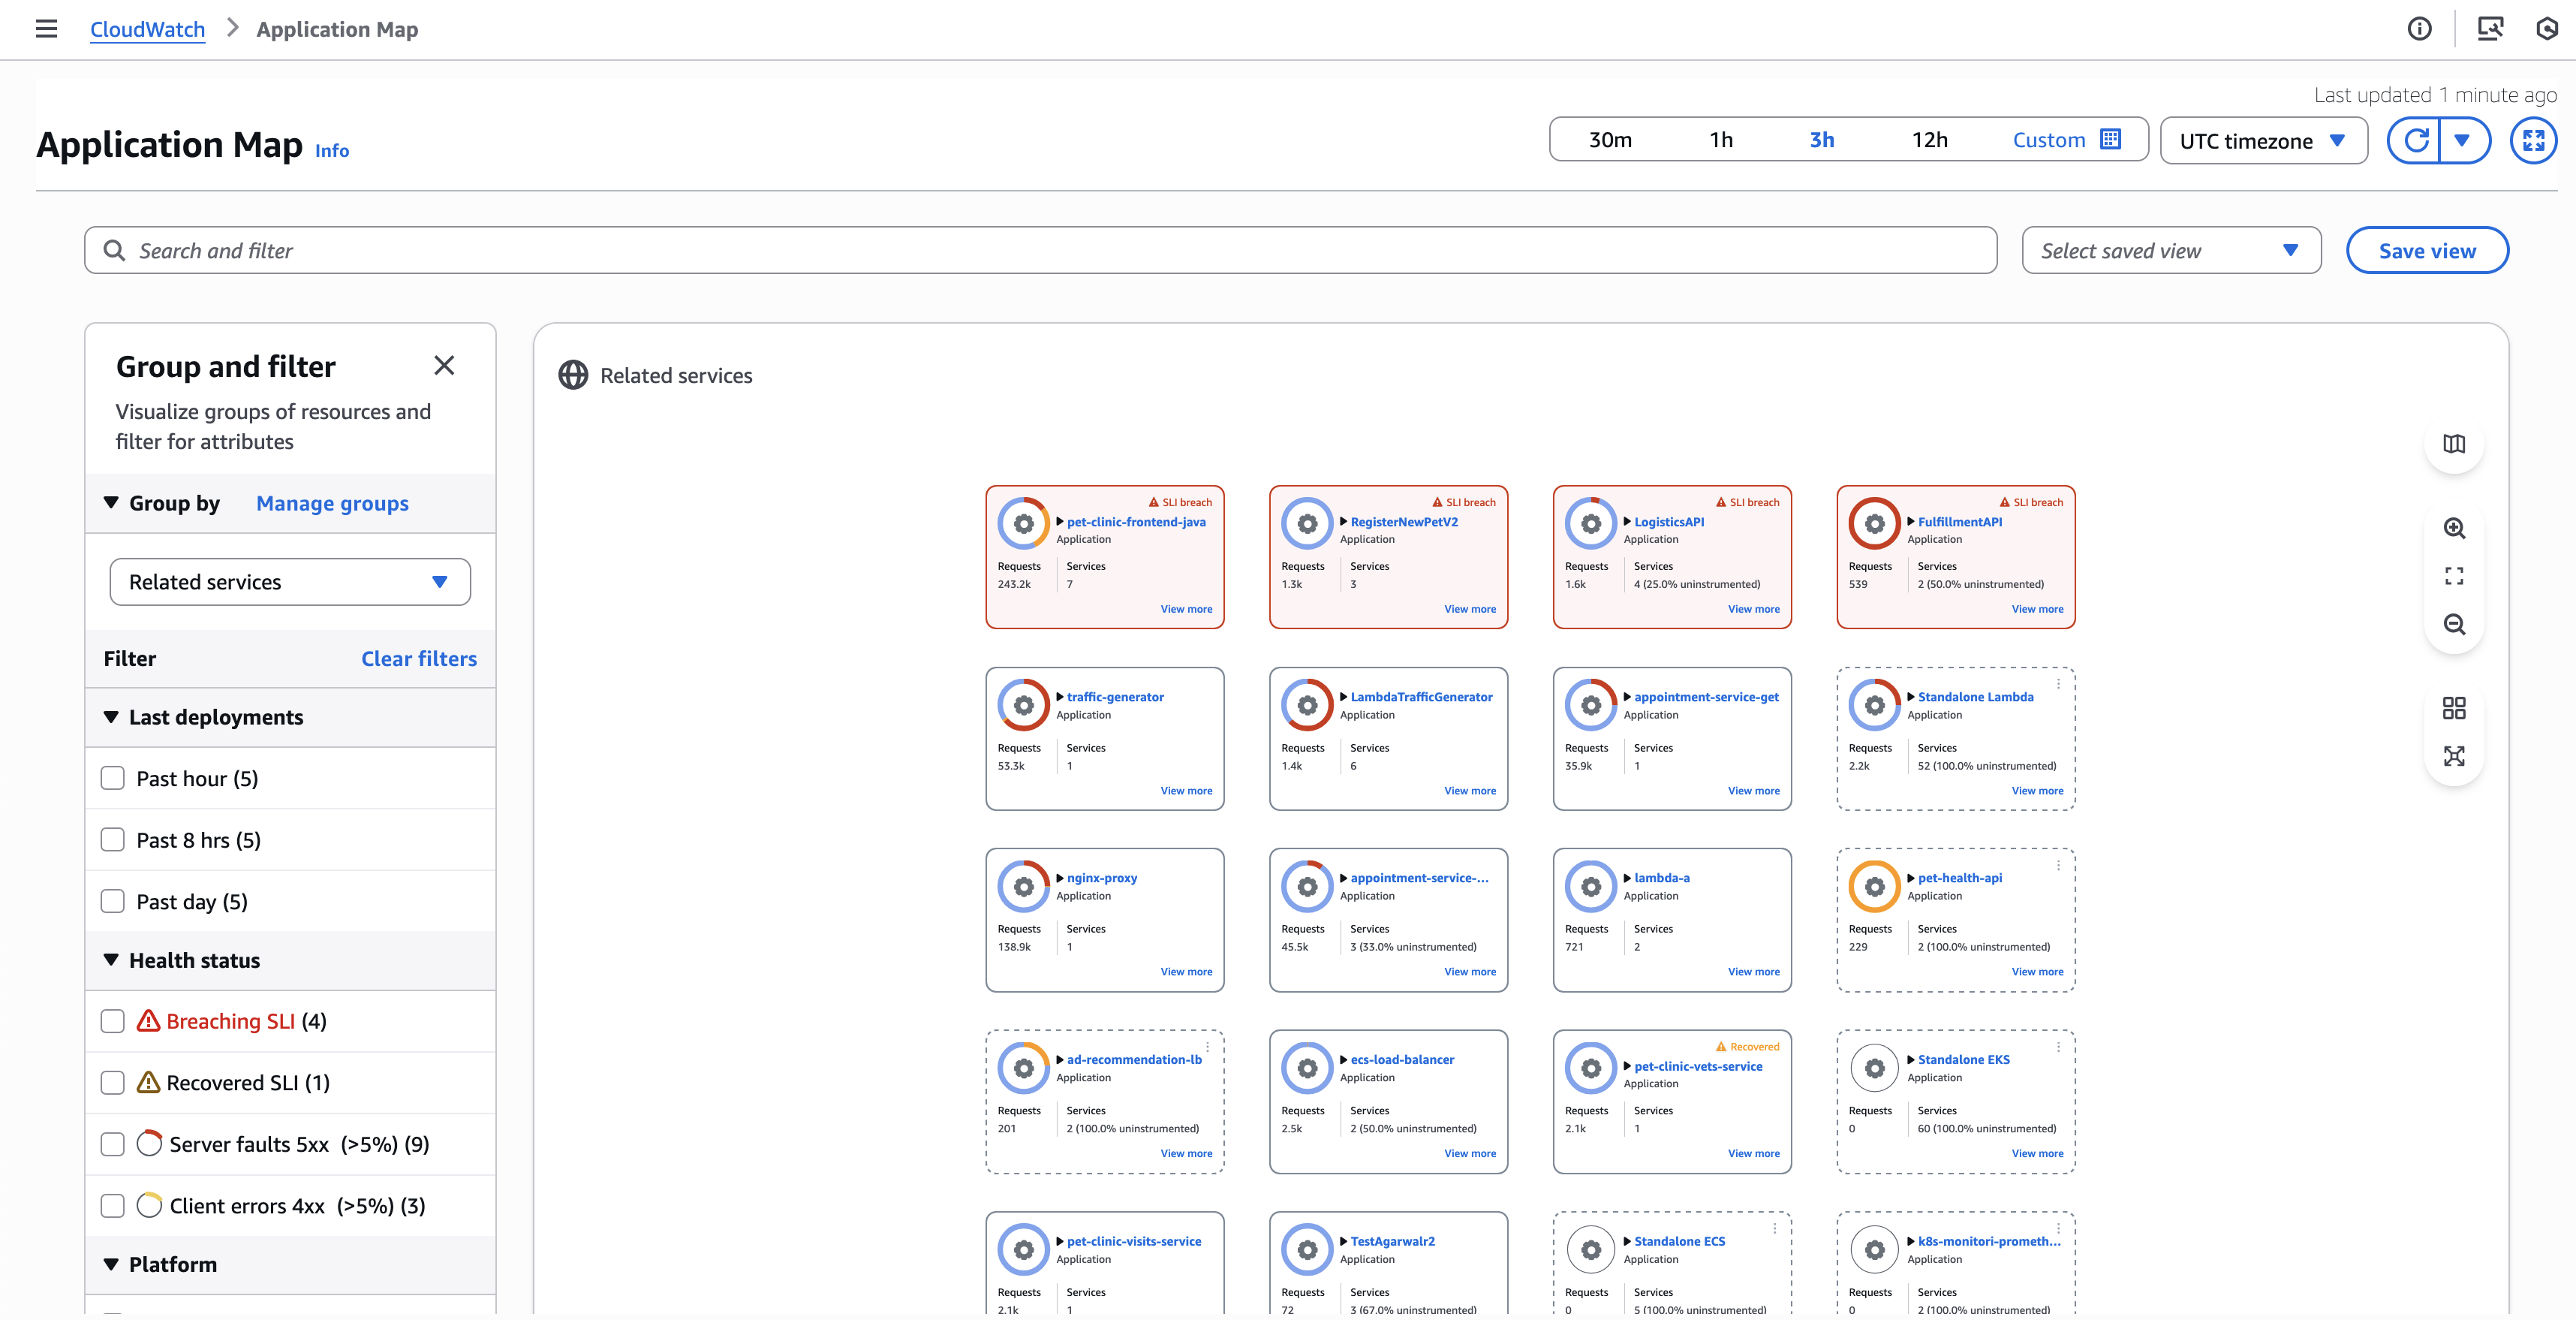
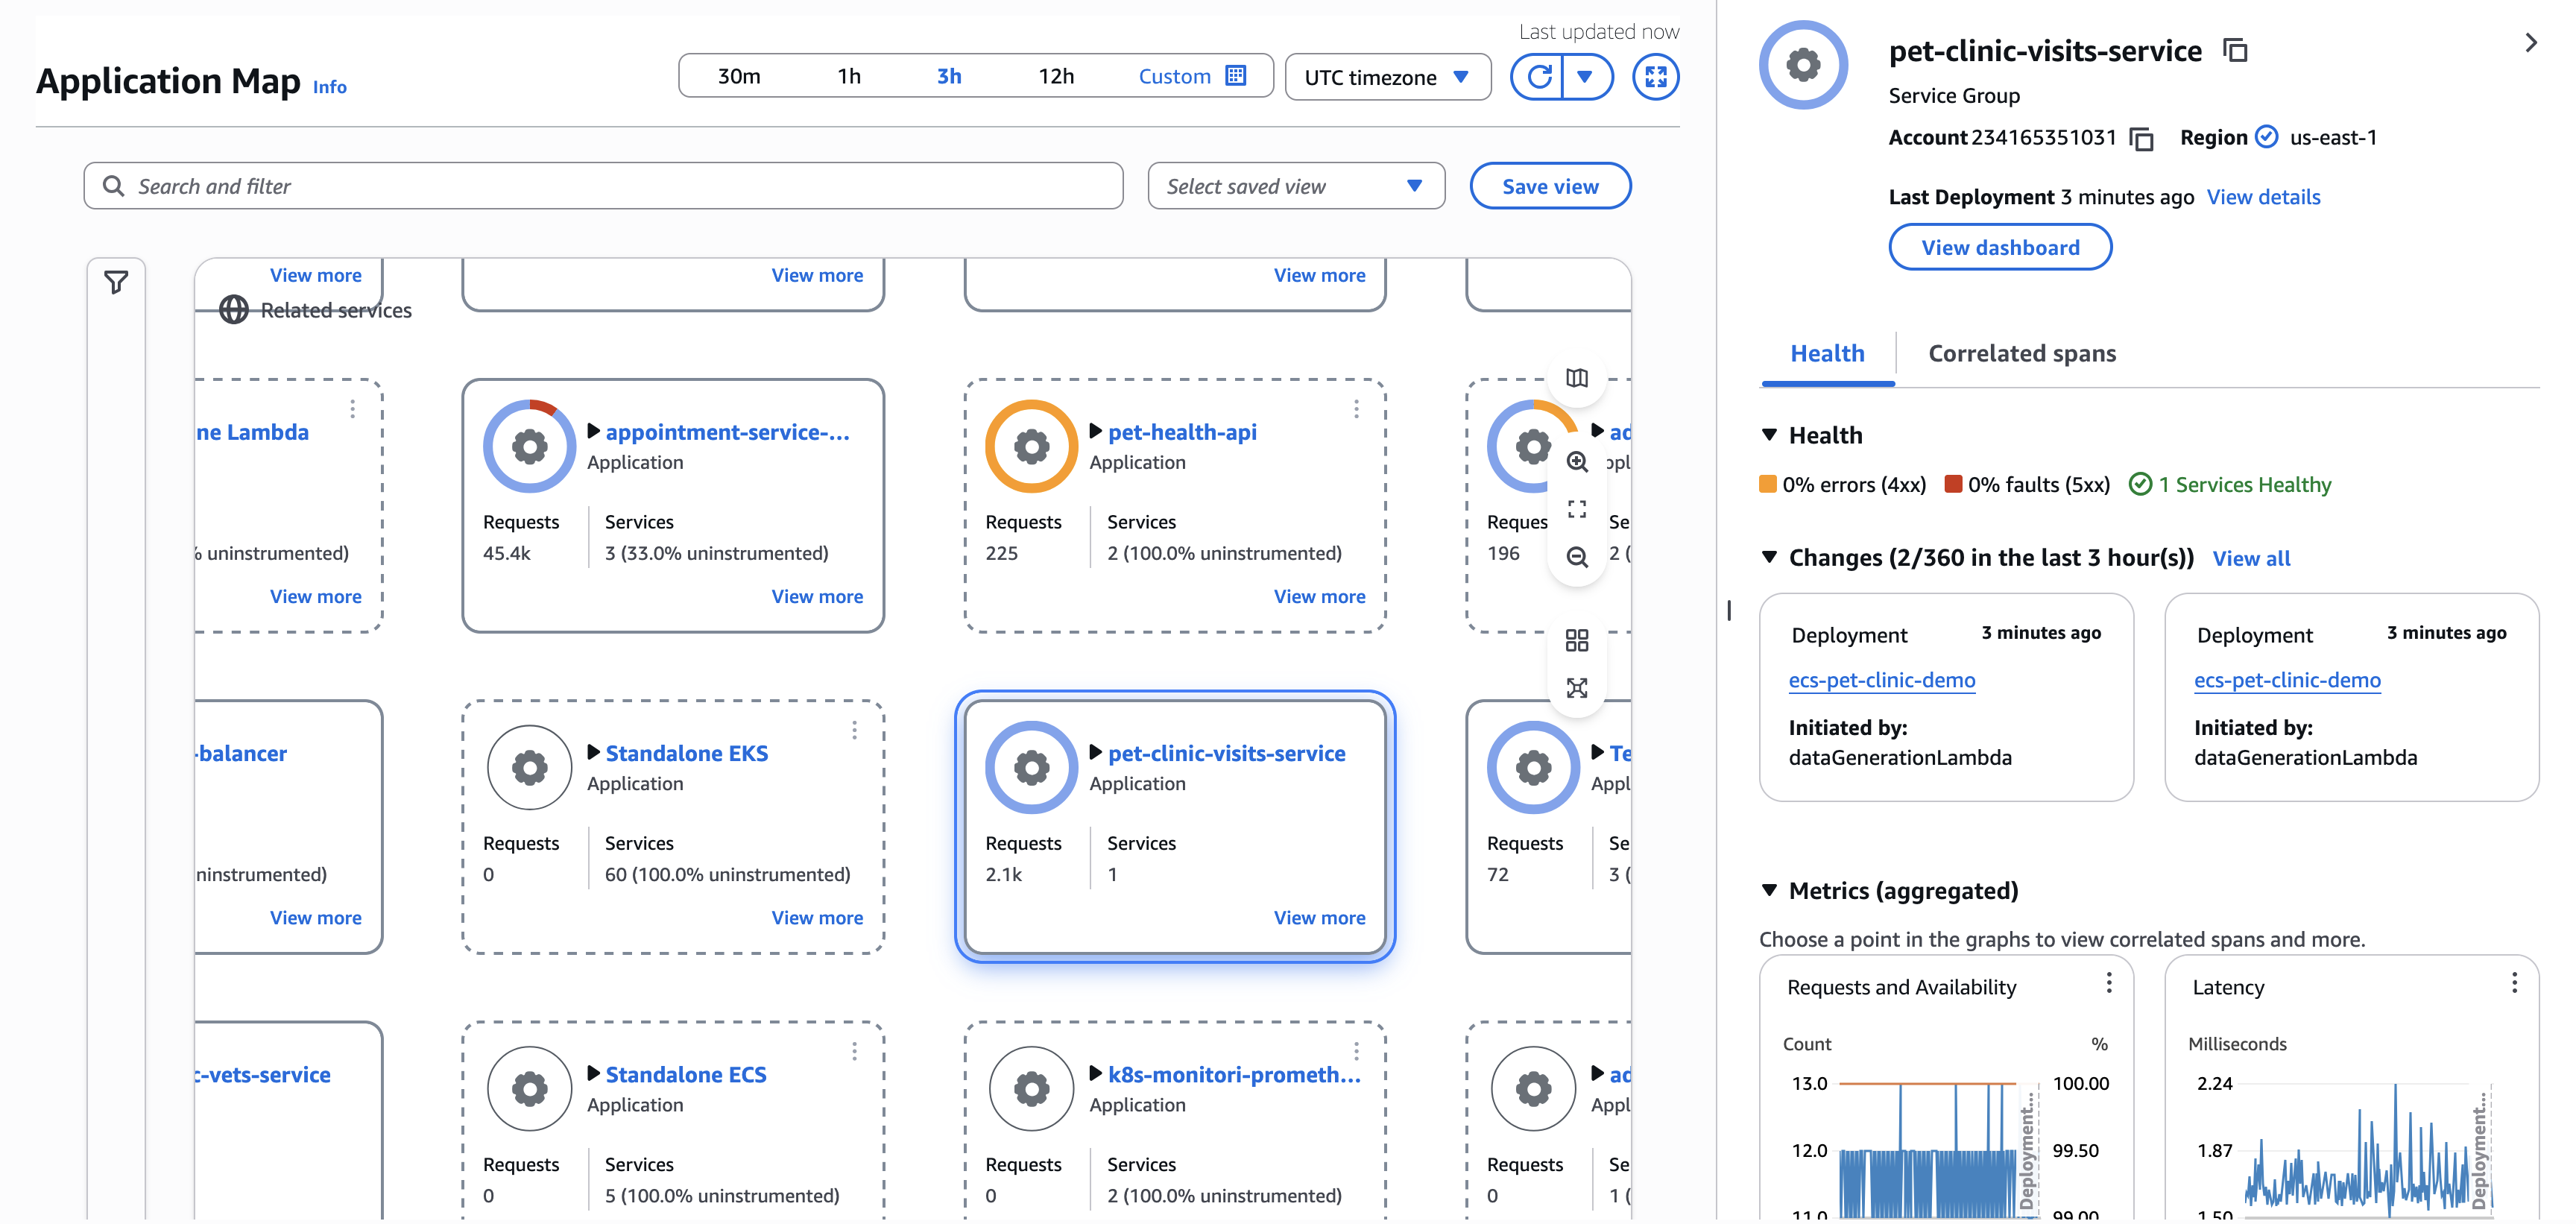
When you visit the application map, by default it shows services grouped by Related services. Related services group services based on their dependencies. For example, if Service A calls Service B, which calls Service C, they're grouped under Service A. You can view SLI health, metrics and service count for all services in each group.
Choose a tab for information about exploring each kind of node and the edges (connections) between them.
Dynamic grouping and filtering
You can click the Group by dropdown to use different grouping options. By default, Application Map provides 2 groupings:
Related services - Groups services based on their dependencies
Environment - Groups services by their environment
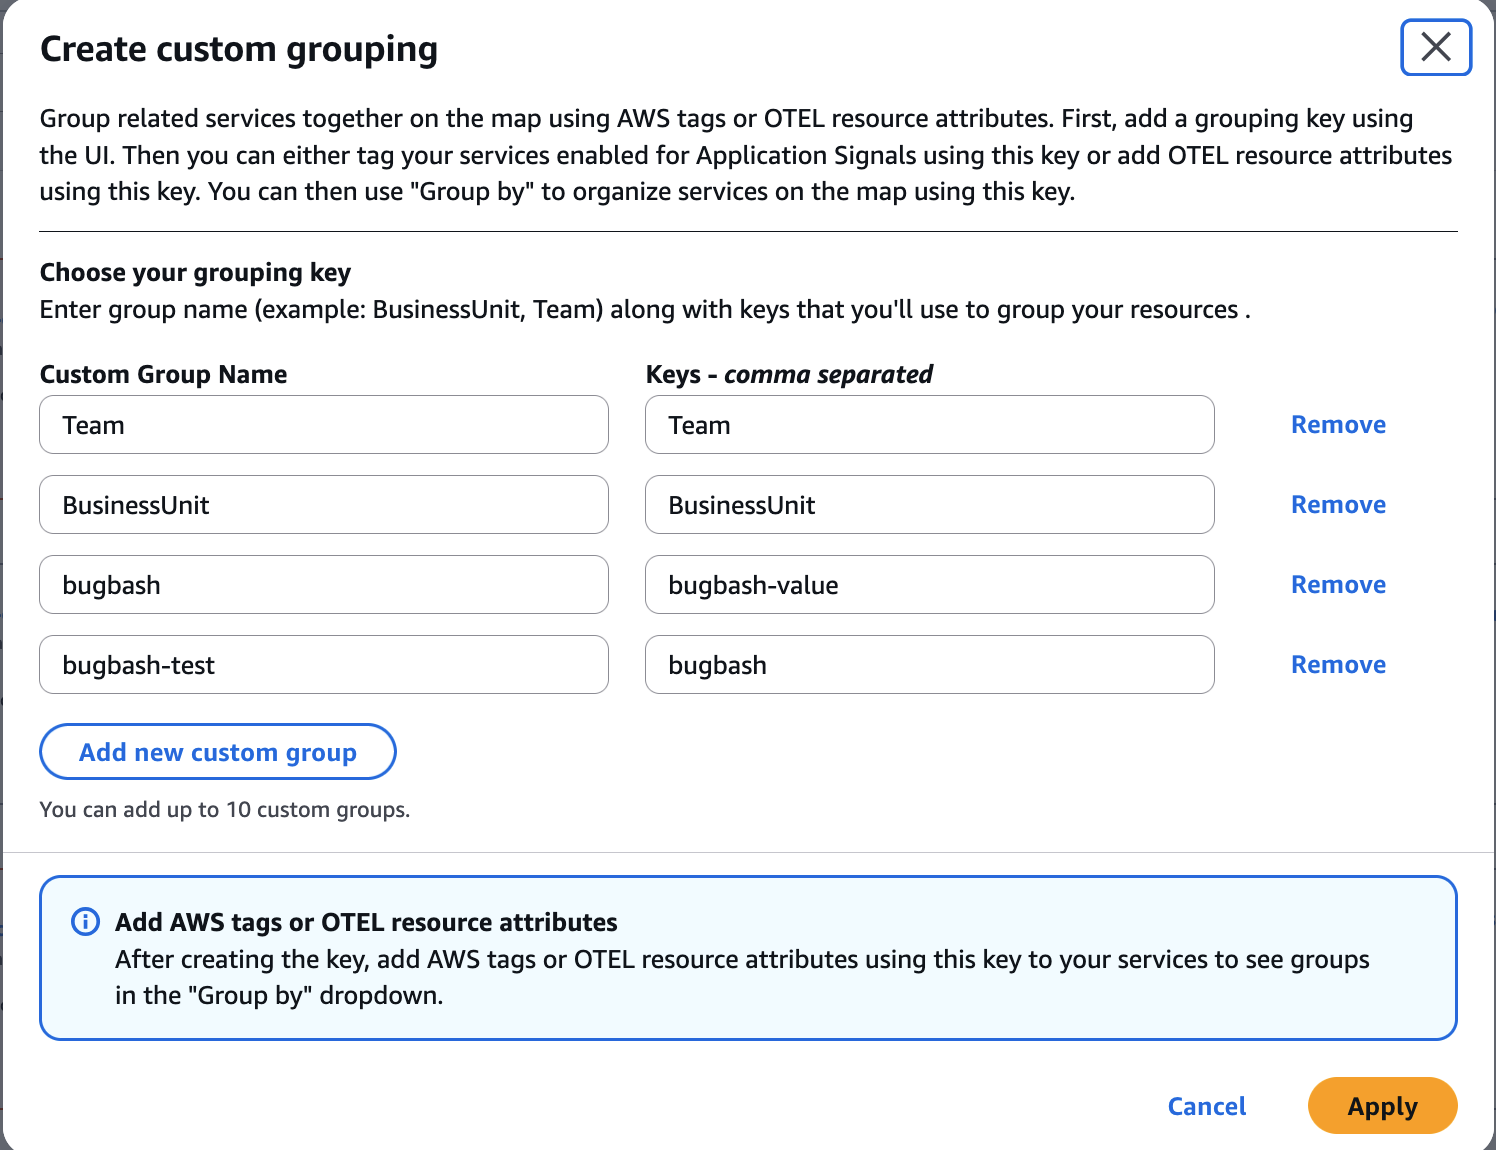
If you want to define your own custom grouping, click Manage groups to define custom groups and then tag your services or add OTEL Resource Attributes with the group key.
Note
To enable grouping via OTEL resource attributes, the CloudWatch agent version must be v1.300056.0 or later.
Default grouping in Application Signals automatically organizes services based on their downstream dependencies. The system analyzes the service dependency graph and creates groups where the root node (a service with no upstream dependencies) becomes the group name. All services that depend on this root service, either directly or indirectly, are automatically included in the group. For example, if Service A calls Service B, which in turn calls Service C, all three services will be grouped together with Service A as the group name since it's the root of the dependency chain. This automatic grouping mechanism provides a natural way to visualize and manage related services based on their actual runtime interactions and dependencies.
Group actions and insights
For each group, you can perform the following actions:
-
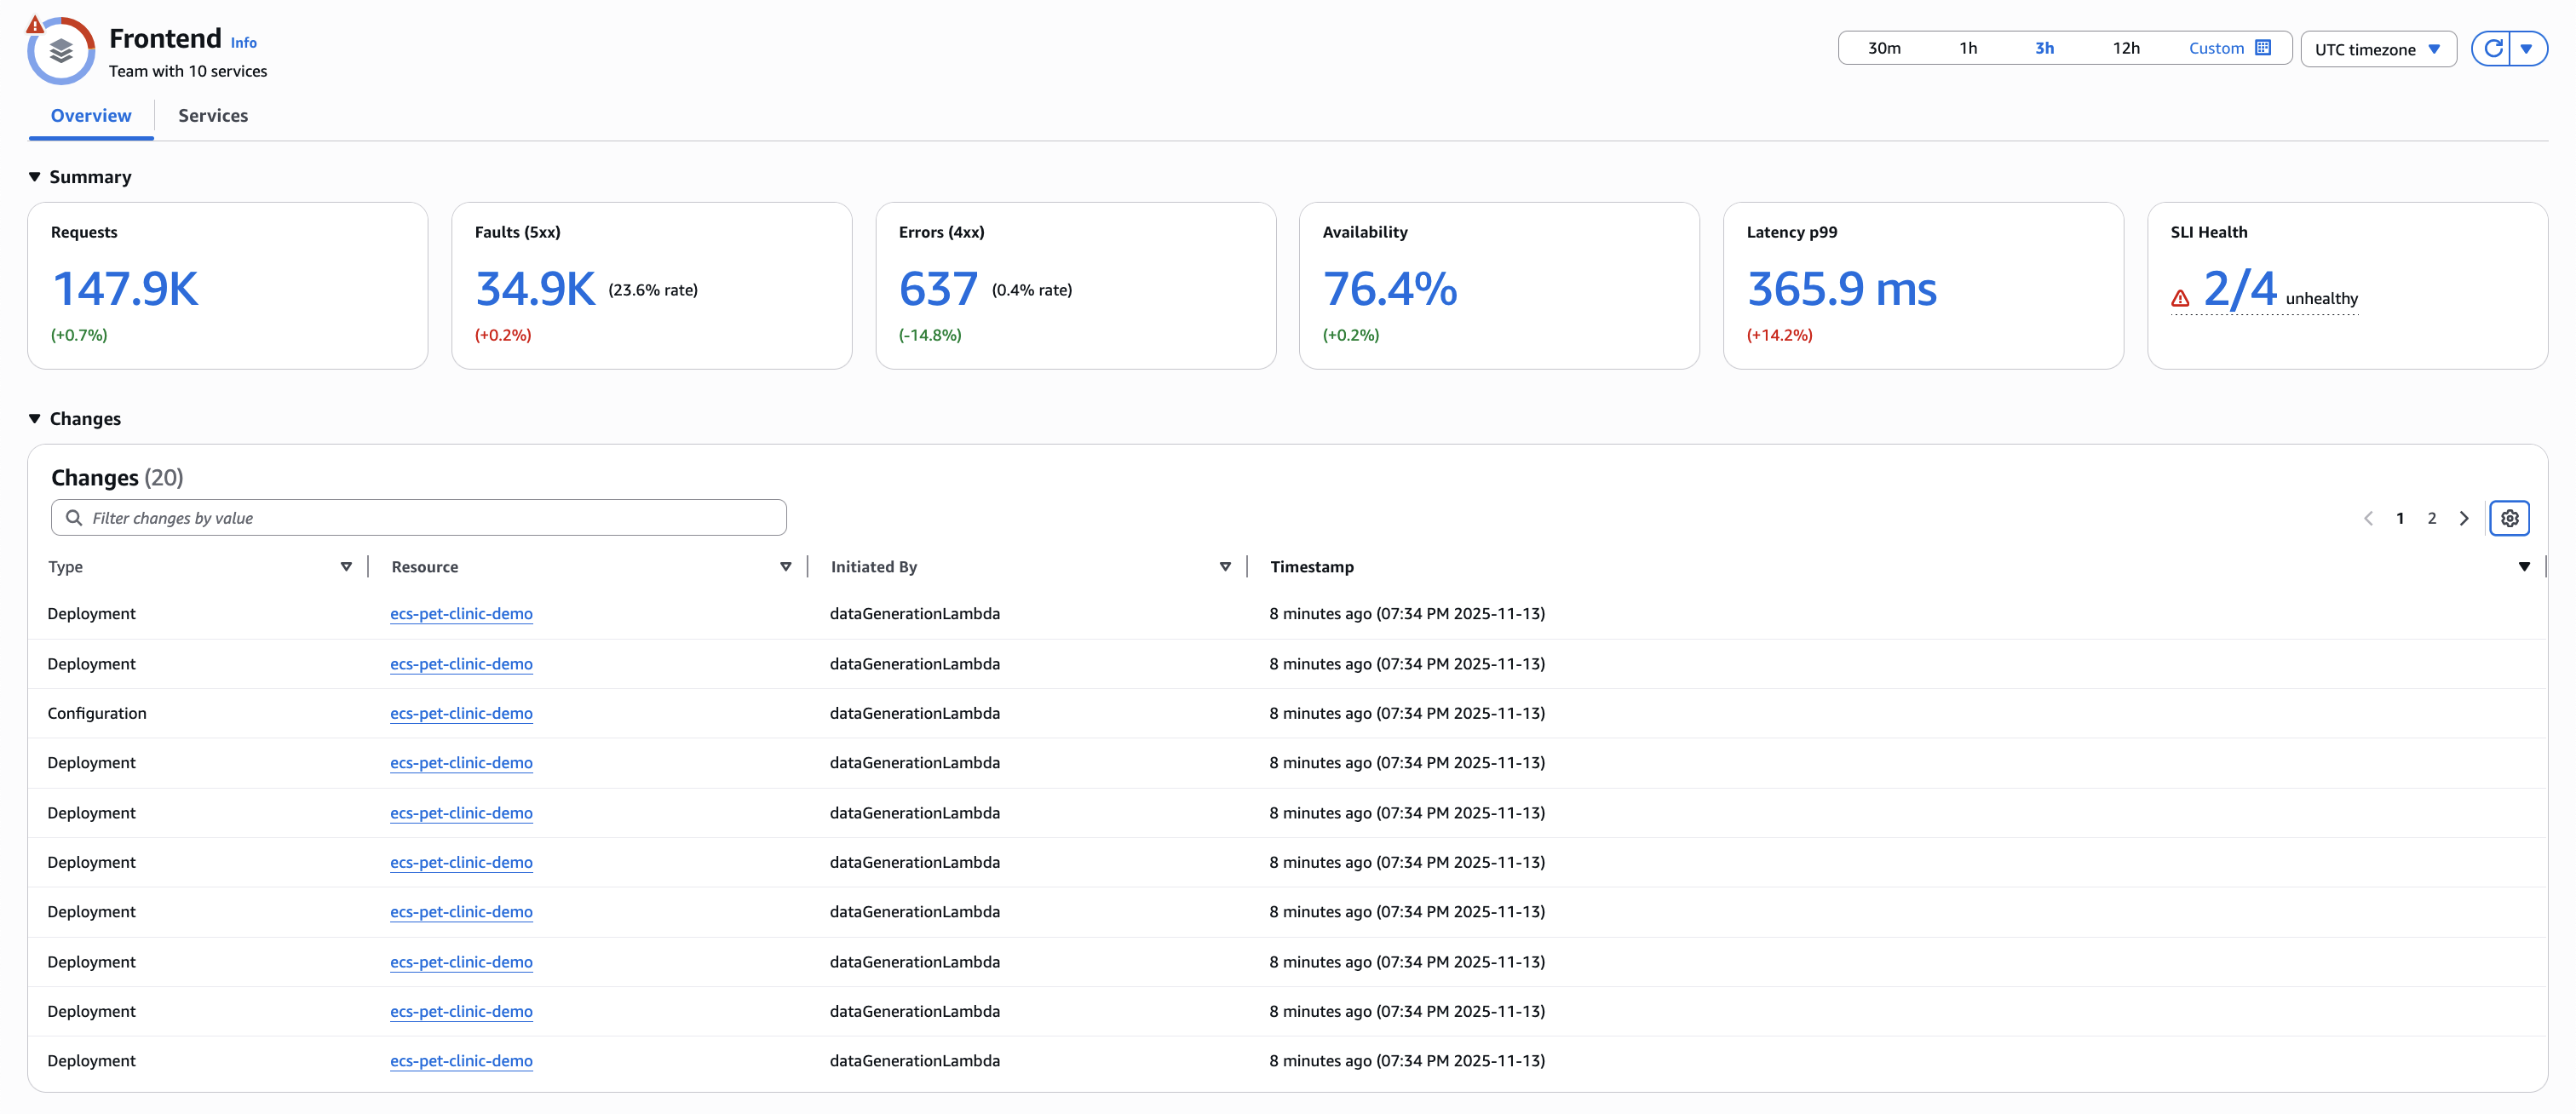
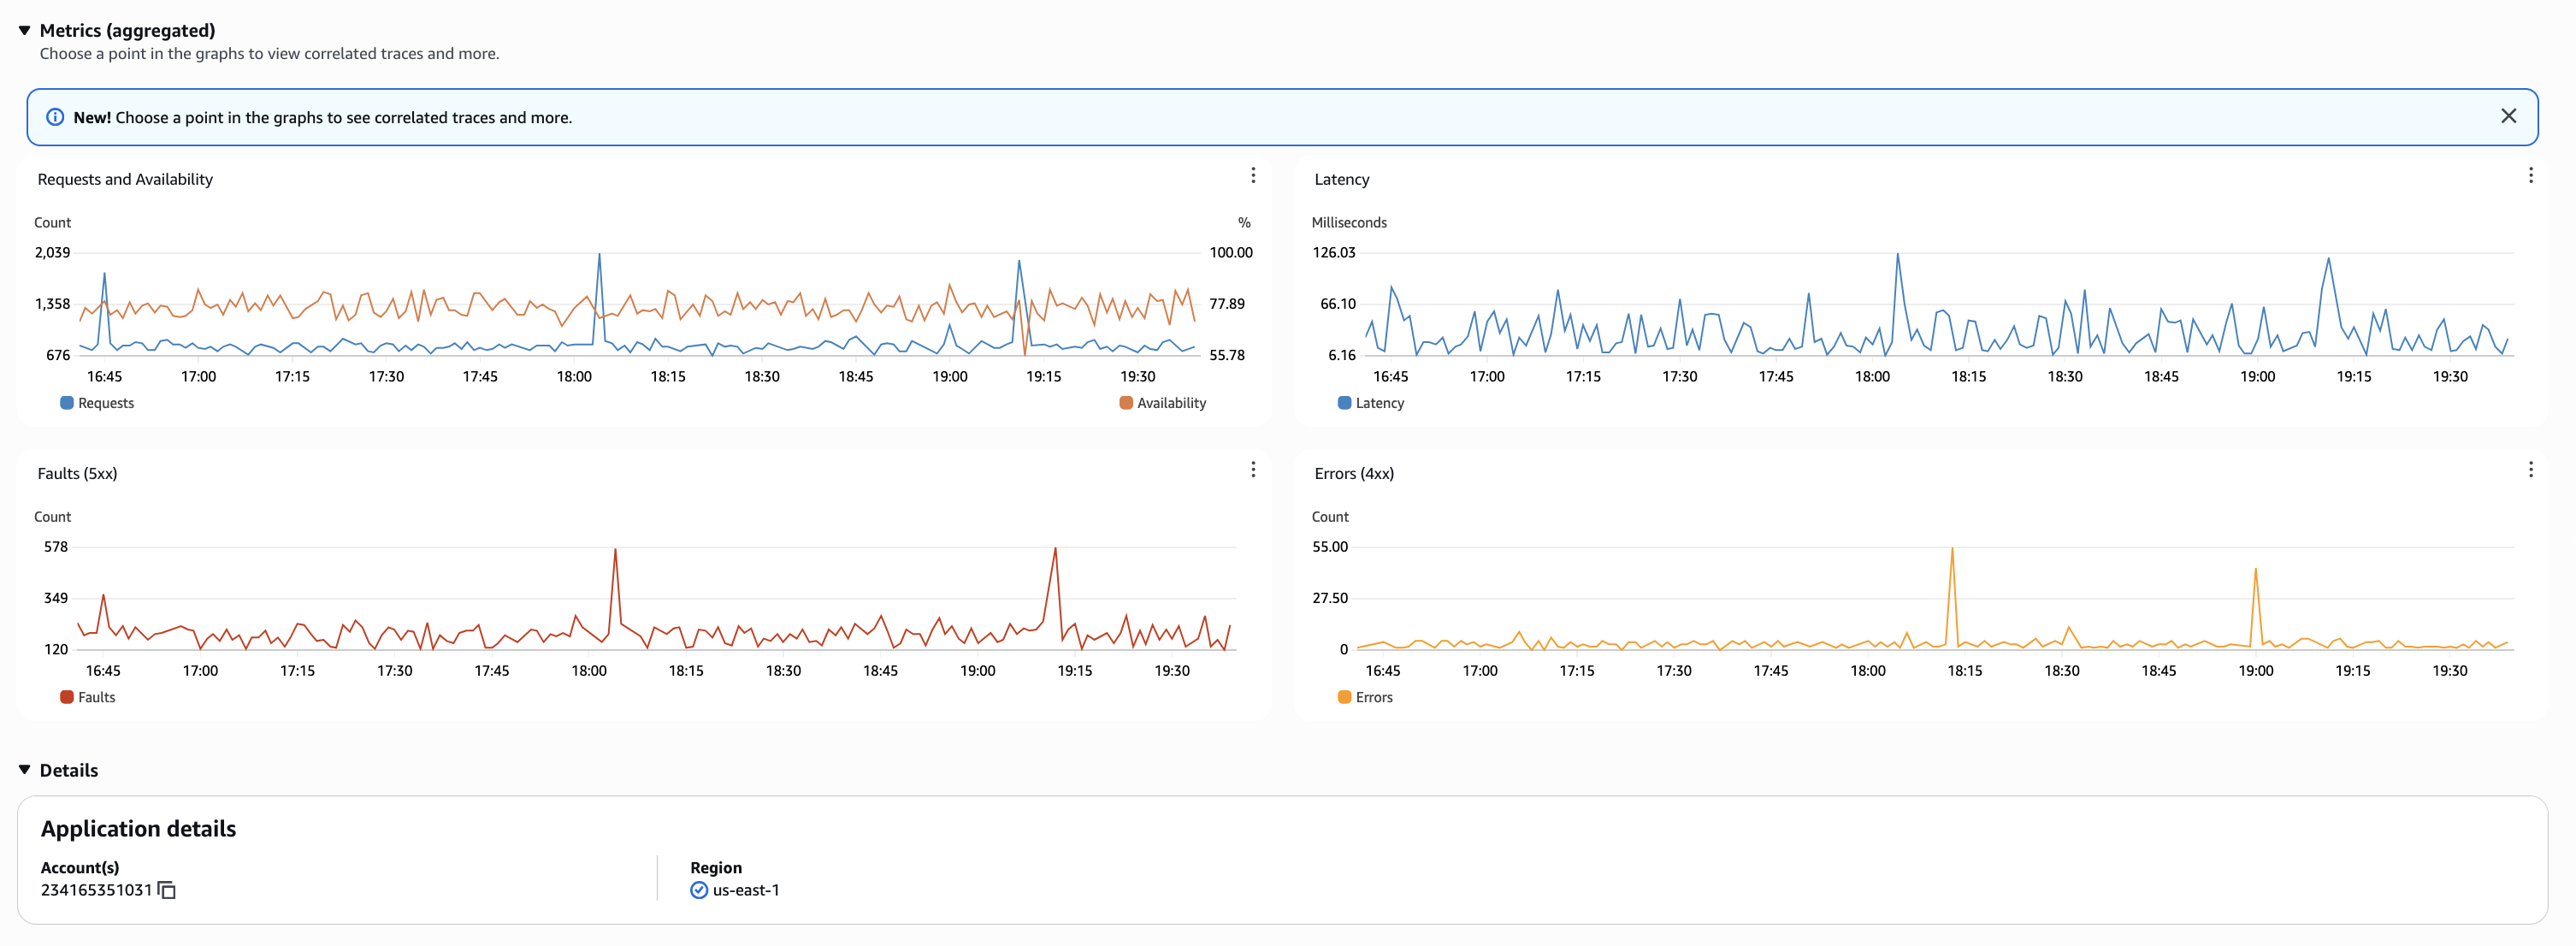
Click View more to view metrics charts, the last two change events, and last deployment time for the group
-
Click View dashboard to view metrics dashboard, change events table, and service list for the group
You can use Group and filter on the left bar to filter groups which have services with deployment time, SLI health status or compute platform type.
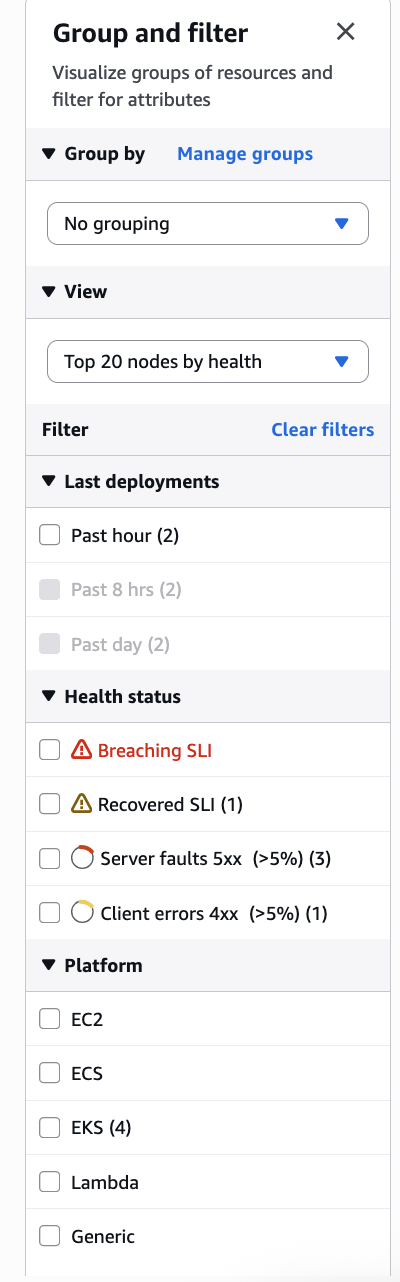
You can also filter by account to view services from specific Amazon accounts in your cross-account observability setup.
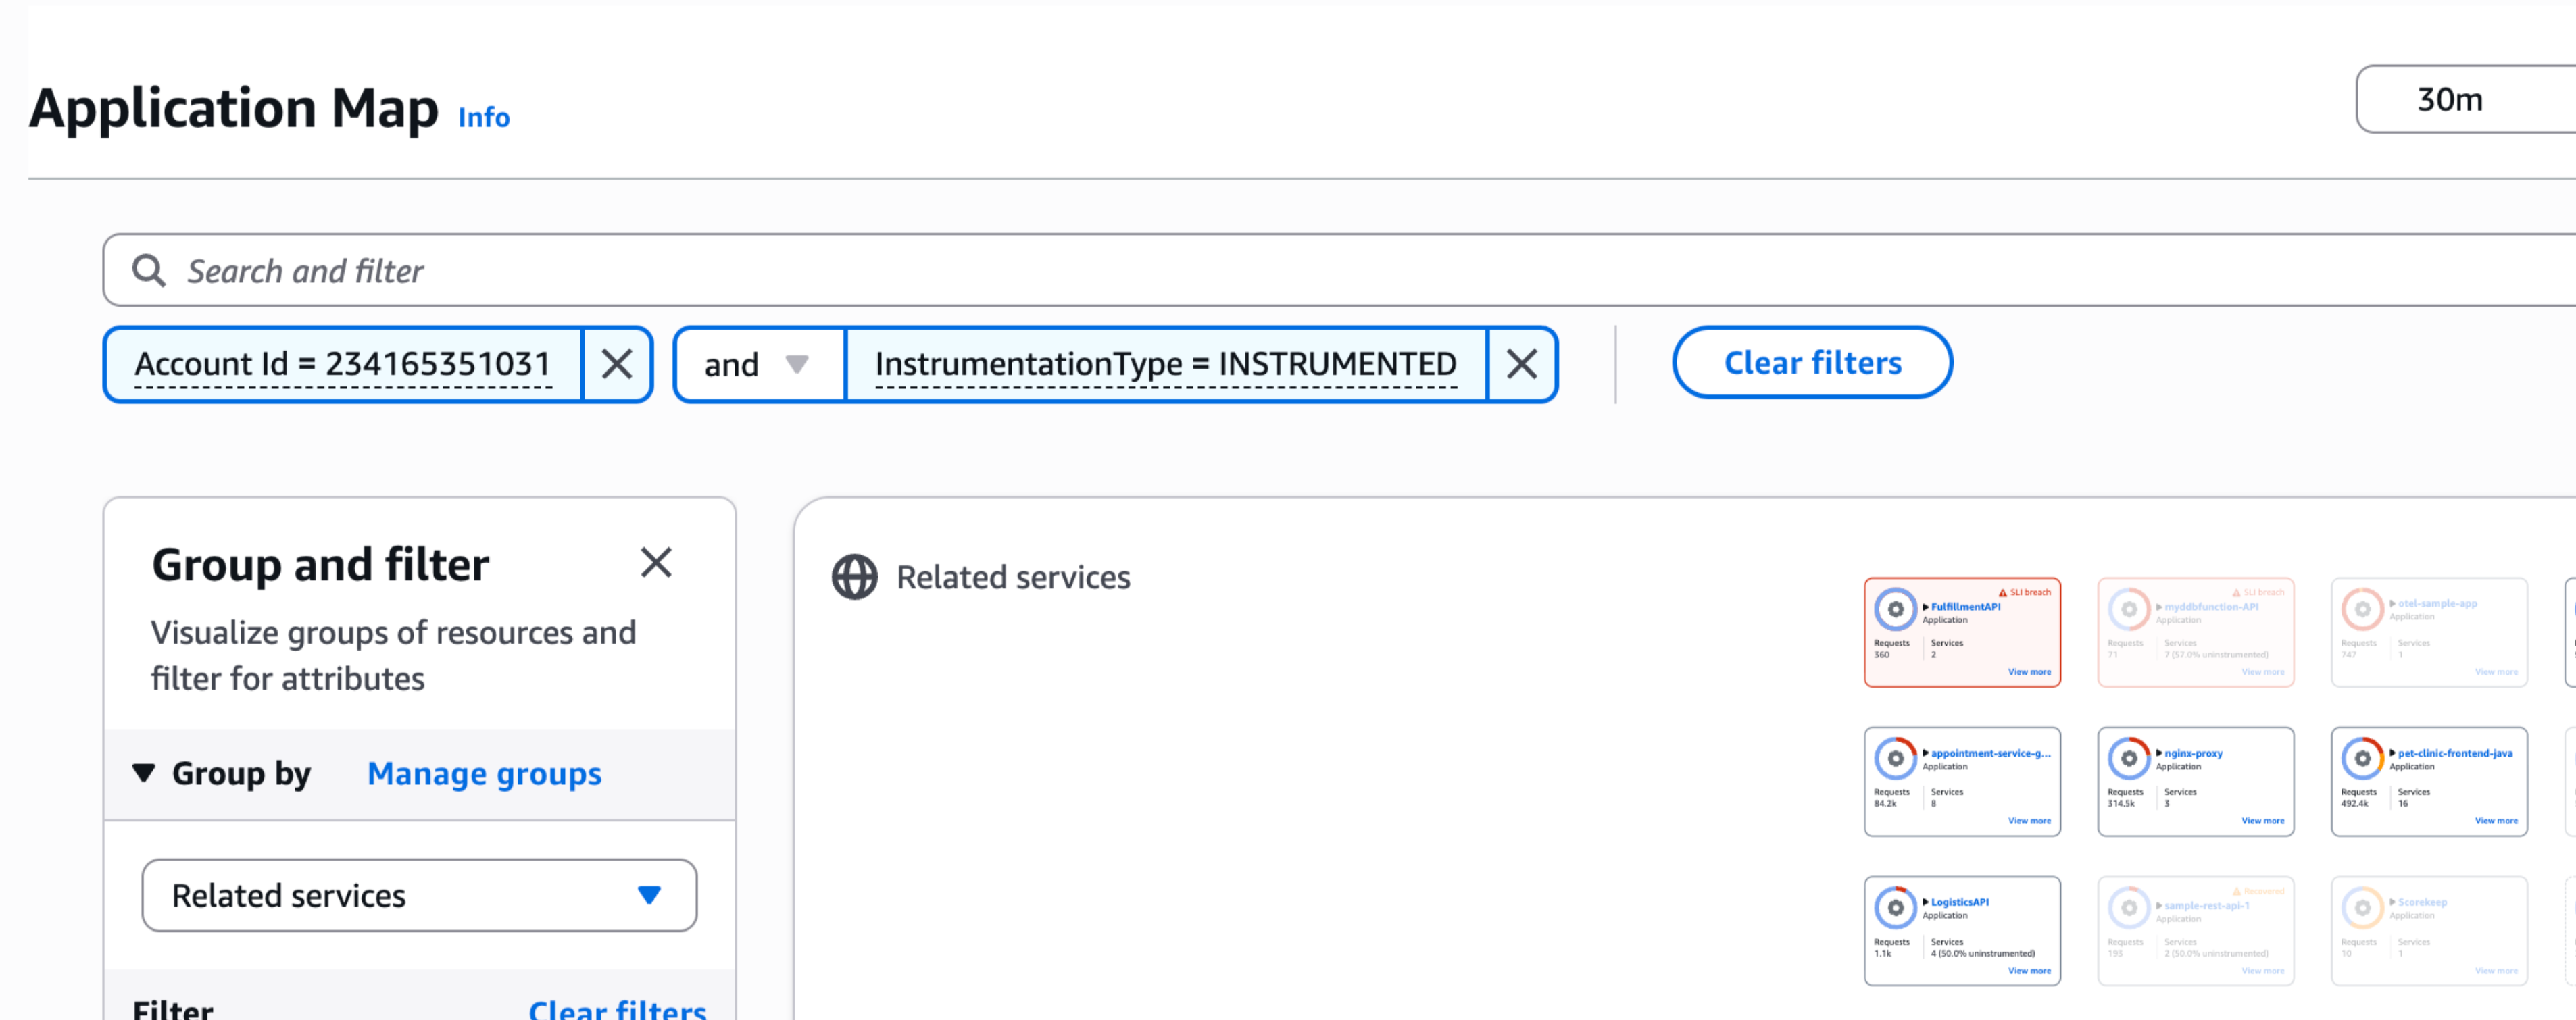
Use the Search and filter bar to search groups by name or search groups which contain specific service environment or dependency. Filter by account ID to focus on services from specific accounts.

Configuring custom groups
Custom grouping allows you to organize your services logically based on your business requirements and operational priorities. This feature enables you to view and save defined views prioritized by your specific needs, create groups based on team ownership, and assemble groups of services needed for critical business transactions.
Create the custom group names (the group names you will see in the UI) and the corresponding group key names. Complete this step either from the Application Signals UI or using the PutGroupingConfiguration API.
Group key names can be either, Amazon tag key or OTEL resource attribute for your service. When deciding between tags and OTEL resource attributes, consider your compute platform:
For single-service platforms (for example, Lambda or Auto Scaling Group) – Use Amazon tags
For multi-service platforms (for example, Amazon EKS cluster) – Use OTEL resource attributes for more granular grouping
Adding Amazon tags
Add an Amazon tag with the custom group key as a key and a value to an Amazon EKS cluster. When there are multiple services running in one Amazon EKS cluster all of them are tagged with the same custom group key. For example, when Amazon EKS Cluster A has Service 1, Service 2 and Service 3 running, adding an Amazon tag with key Team X to the cluster will add all three services to Team X. To add only specific services to Team X, add OTEL resource attributes for the services as shown below.
Adding OTEL resource attributes
To add an OTEL resource attribute, see the configuration below:
General configuration
Configure the OTEL_RESOURCE_ATTRIBUTES environment variable in your application using the custom group key-value pairs. The keys are listed under
aws.application_signals.metric_resource_keys separated by &.
For example, to create custom groups using Application=PetClinic and Owner=Test, use the following:
OTEL_RESOURCE_ATTRIBUTES=Application=PetClinic,Owner=Test,aws.application_signals.metric_resource_keys=Application&Owner
Platform-specific configuration
The following are the deployment specifications.
Amazon EKS and native kubernetes
apiVersion: apps/v1
kind: Deployment
metadata:
  ...
spec:
  replicas: 1
  ...
  template:
    spec:
      containers:
      - name: your-app
        image: your-app-image
        env:
          ...
          - name: OTEL_RESOURCE_ATTRIBUTES
            value: Application=PetClinic,Owner=Test,aws.application_signals.metric_resource_keys=Application&Owner
Amazon EC2
Add OTEL_RESOURCE_ATTRIBUTES to your application start script. For the complete example, see Adding OTEL_RESOURCE_ATTRIBUTES.
...
OTEL_RESOURCE_ATTRIBUTES="service.name=$YOUR_SVC_NAME,Application=PetClinic,Owner=Test,aws.application_signals.metric_resource_keys=Application&Owner" \
java -jar $MY_JAVA_APP.jar
Amazon ECS
Add OTEL_RESOURCE_ATTRIBUTES to the TaskDefinition. For the complete example, see Enable on Amazon ECS.
{
  "name": "my-app",
   ...
  "environment": [
    {
      "name": "OTEL_RESOURCE_ATTRIBUTES",
      "value": "service.name=$YOUR_SVC_NAME,Application=PetClinic,Owner=Test,aws.application_signals.metric_resource_keys=Applicationmanagement portalOwner"
    },
    ...
  ]
}
Lambda
Add OTEL_RESOURCE_ATTRIBUTES to the Lambda environment variable.
OTEL_RESOURCE_ATTRIBUTES="Application=PetClinic,Owner=Test,aws.application_signals.metric_resource_keys=Application&Owner"
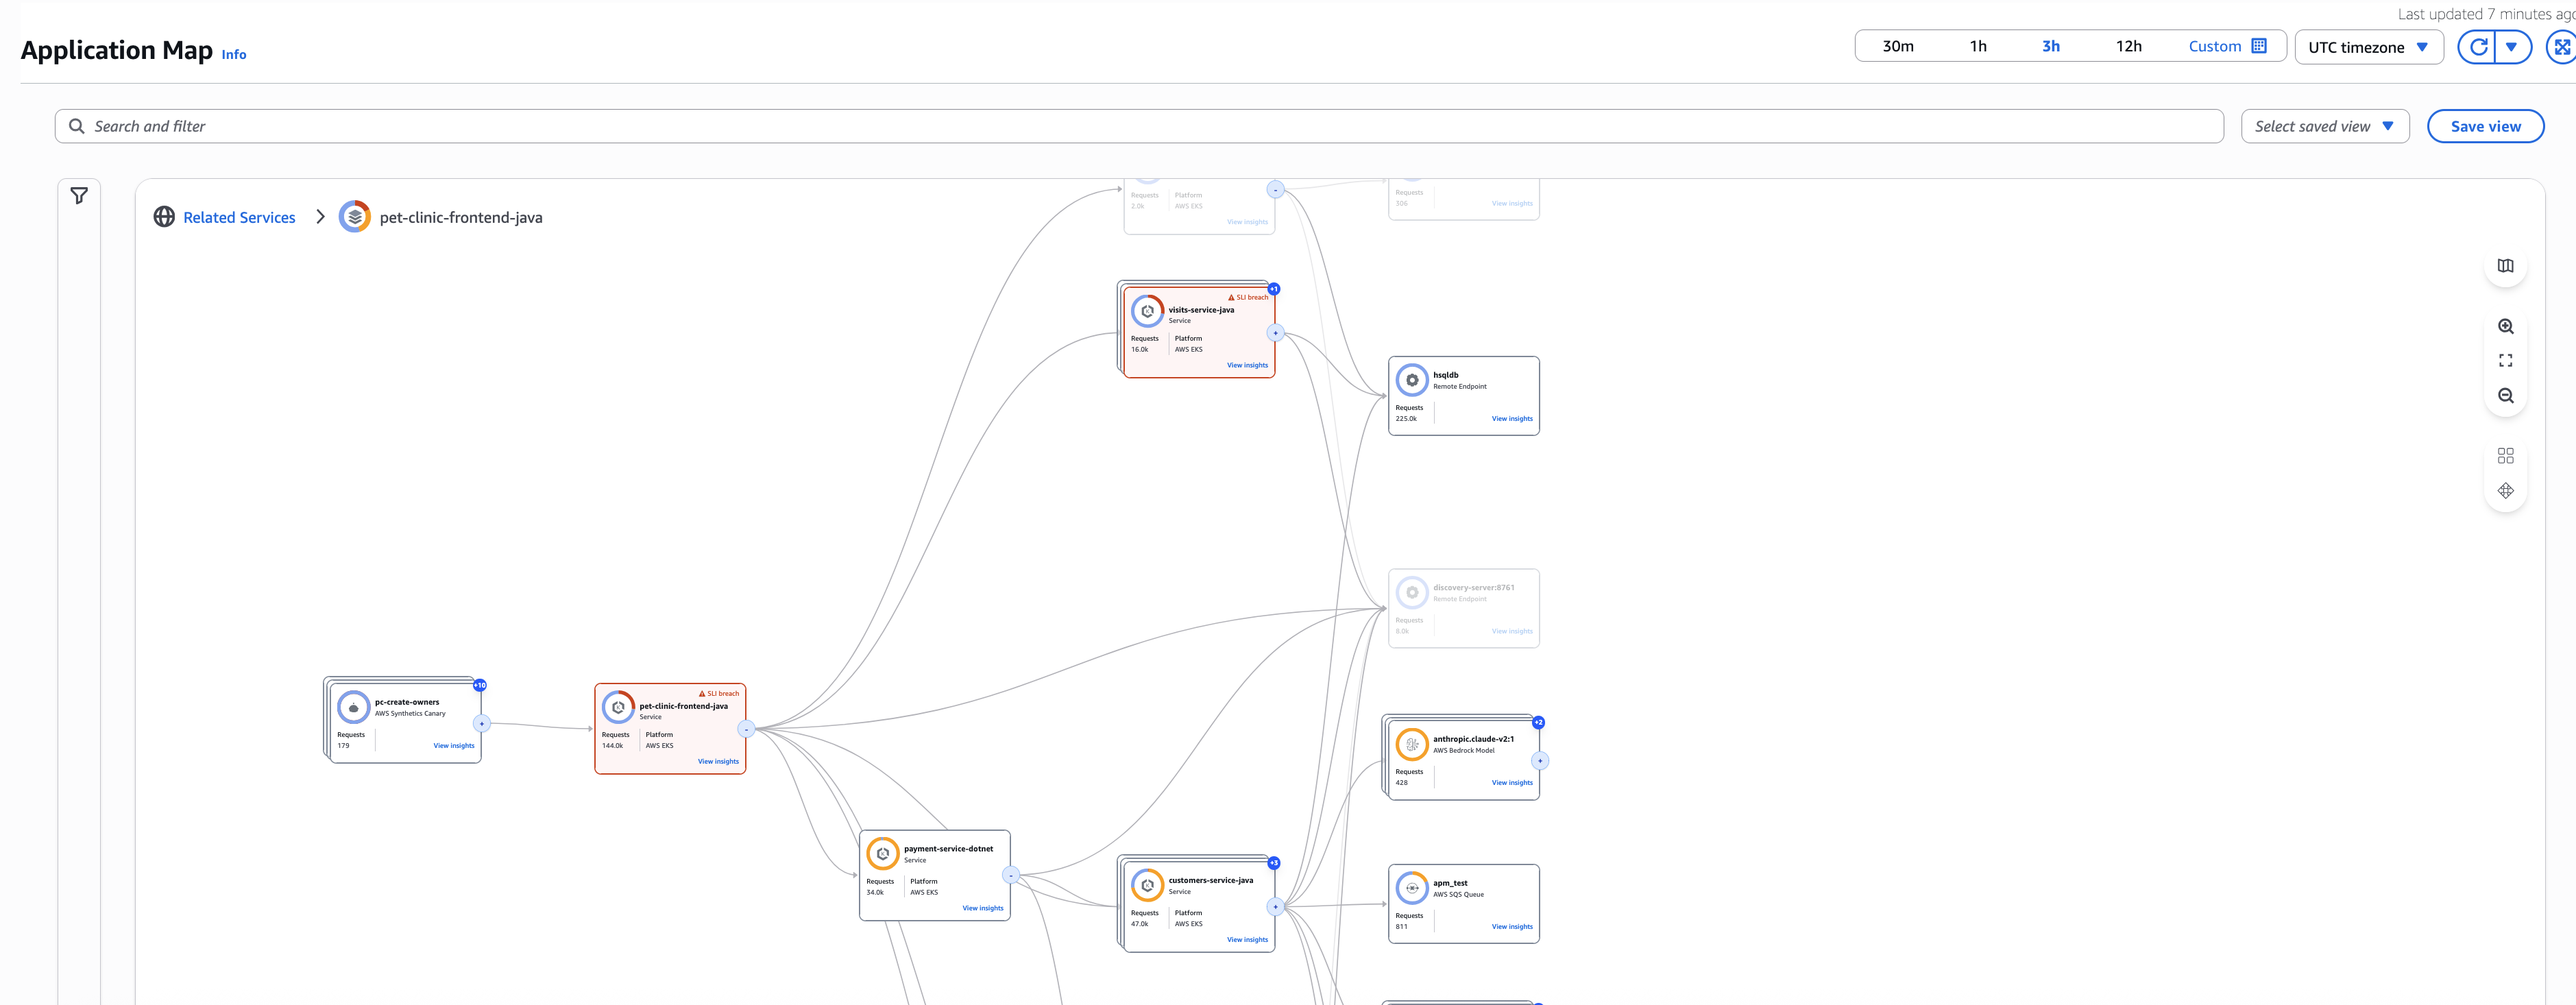
Viewing services within groups
To view services and their dependencies in a group, click on the Group name. It will show a map of services inside the group. Each service node will show SLI health, metrics and platform details. Services with SLI breach are highlighted to be easily recognizable.
Un-instrumented services are displayed with a distinctive visual indicator (such as a dashed border or different color) to differentiate them from instrumented services. Hover over an un-instrumented service node to see instrumentation guidance and links to setup documentation.
All Canaries, RUM Clients and Amazon Service nodes will be collapsed by default. If services in this group call services which are not part of this group, they will also be collapsed by default.
If your map is still too large to investigate effectively, you can apply nested grouping to narrow down your investigation. For example, after grouping services by Business Unit, if you still have too many services in a group, use the Group by dropdown to select Team, creating a nested grouping structure.
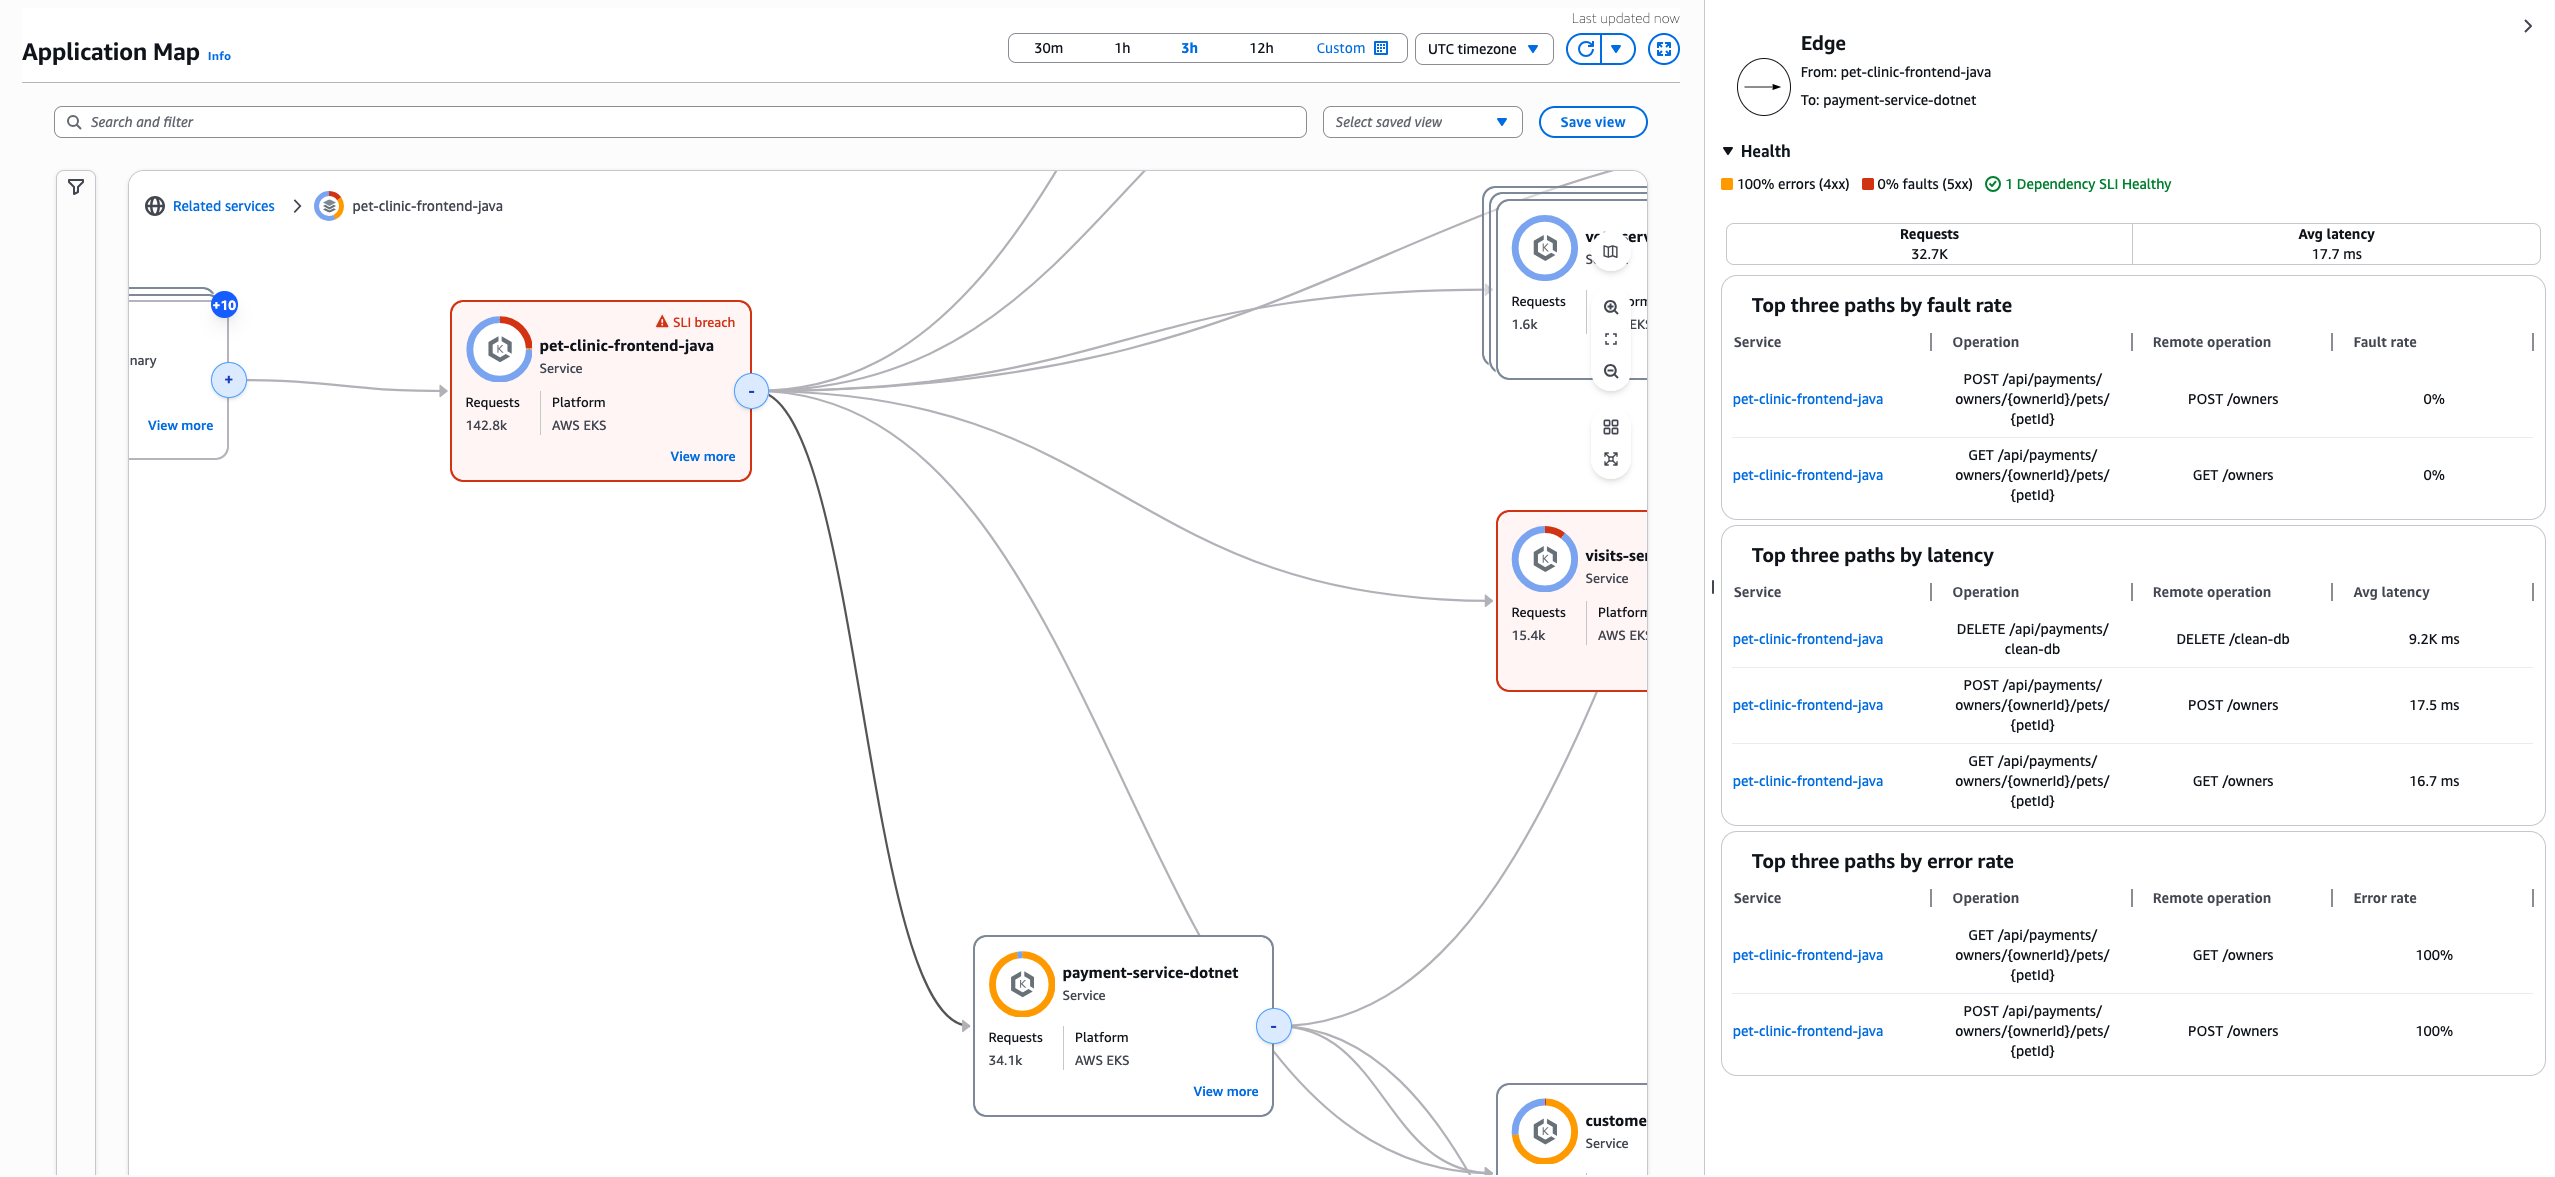
Service insights and details
While on this page you can also click Save view next to search bar to save your view so next time you don't have to apply the same grouping and filtering again.
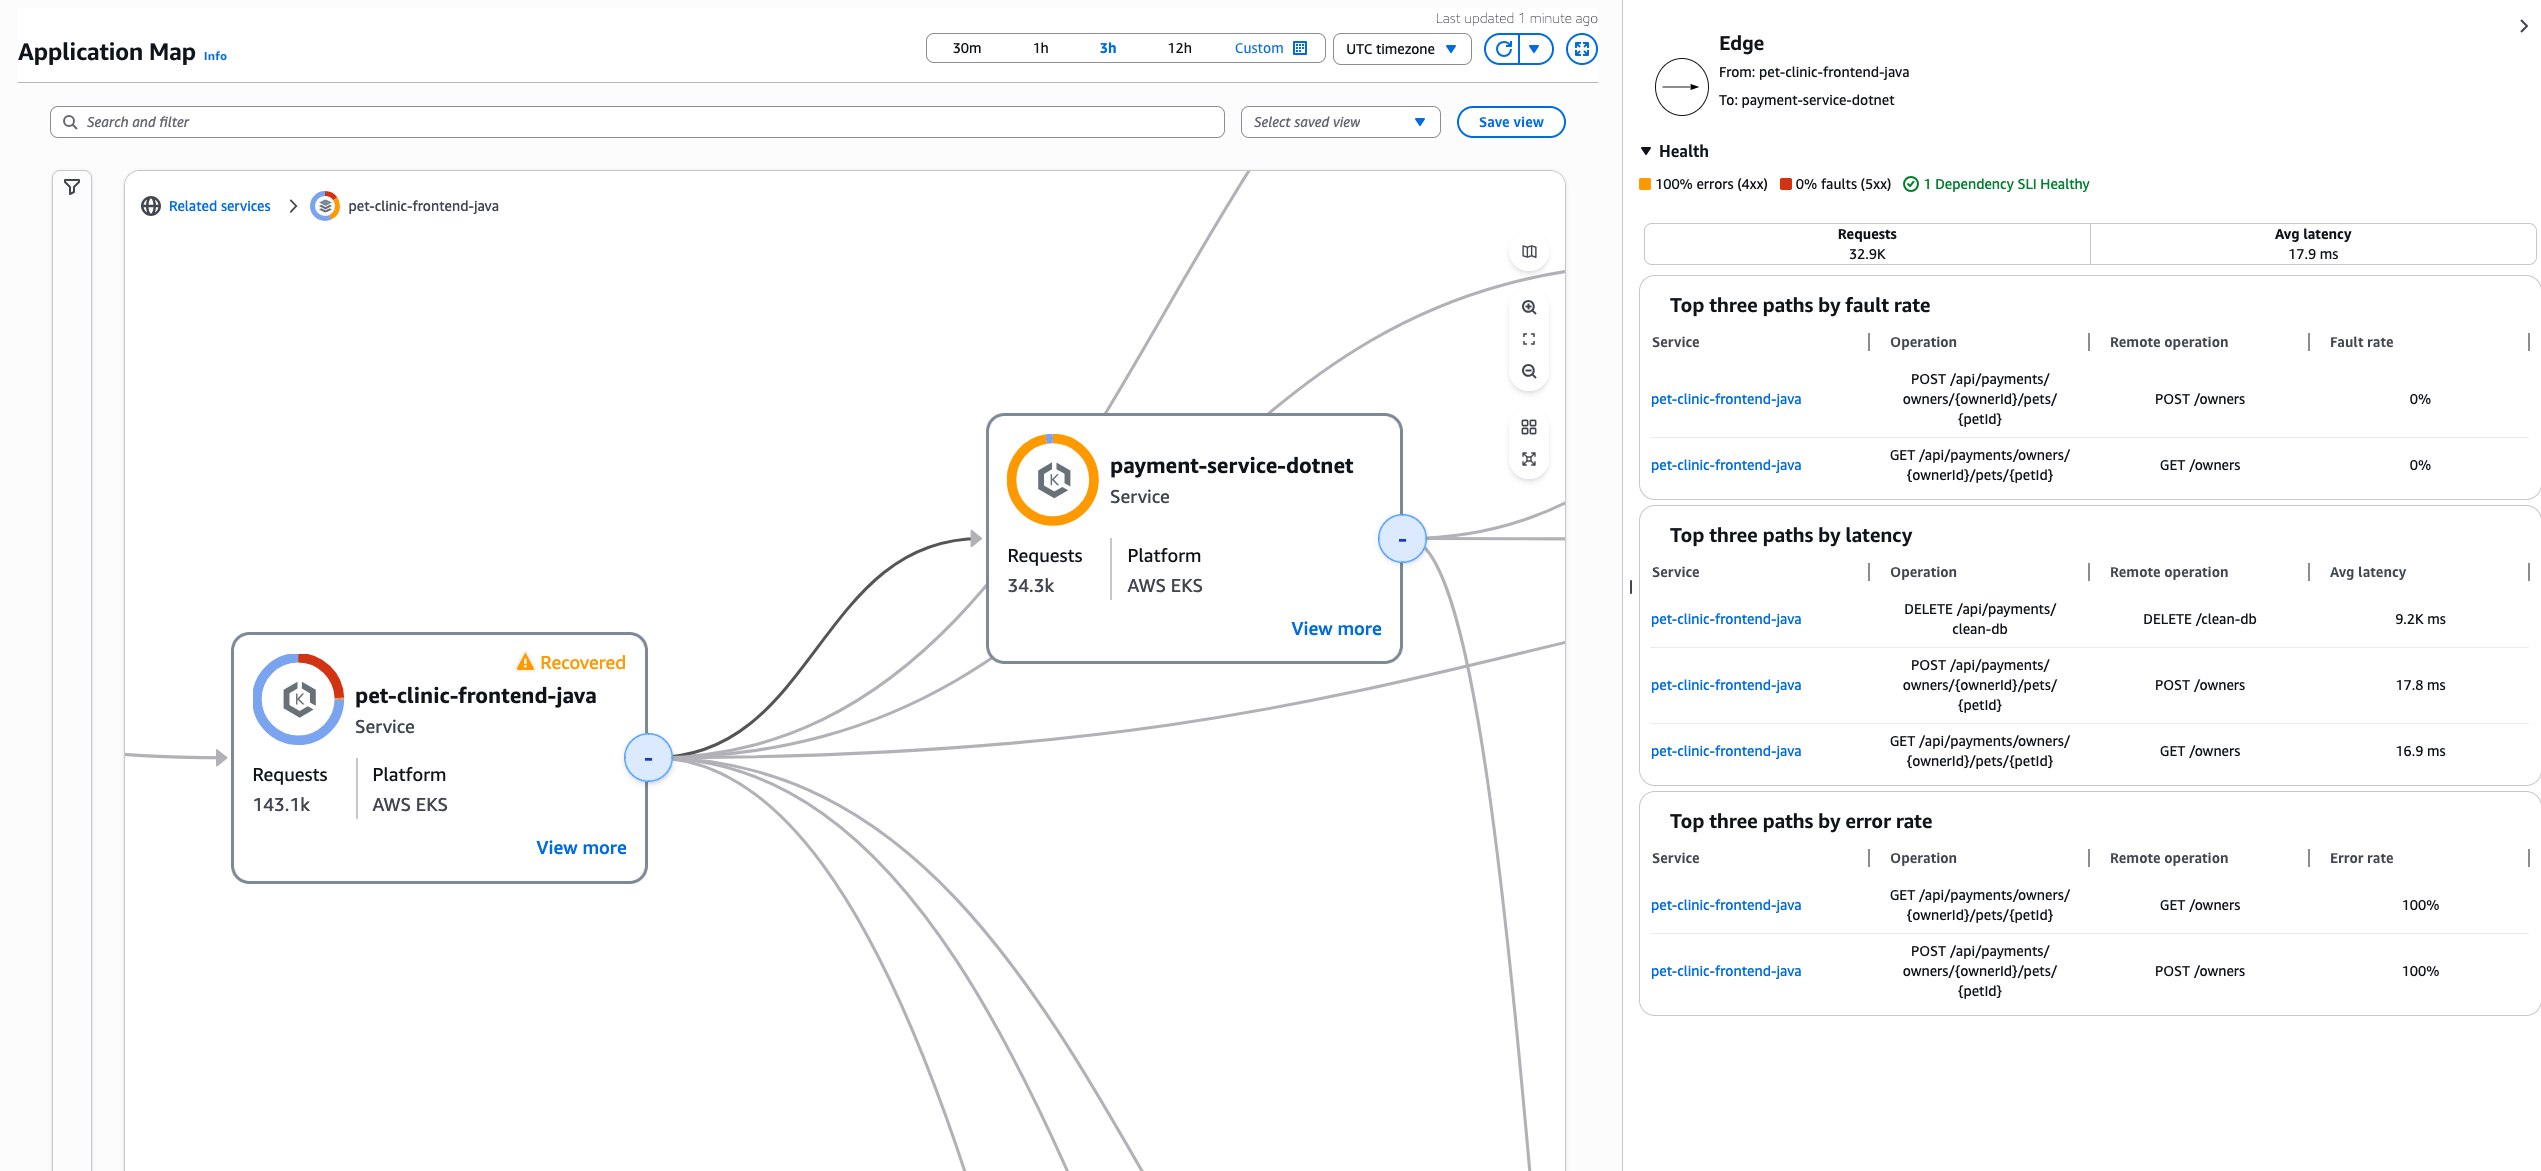
Click on View more in service node to view Service Audit, Change events, SLI health and Metrics graphs.
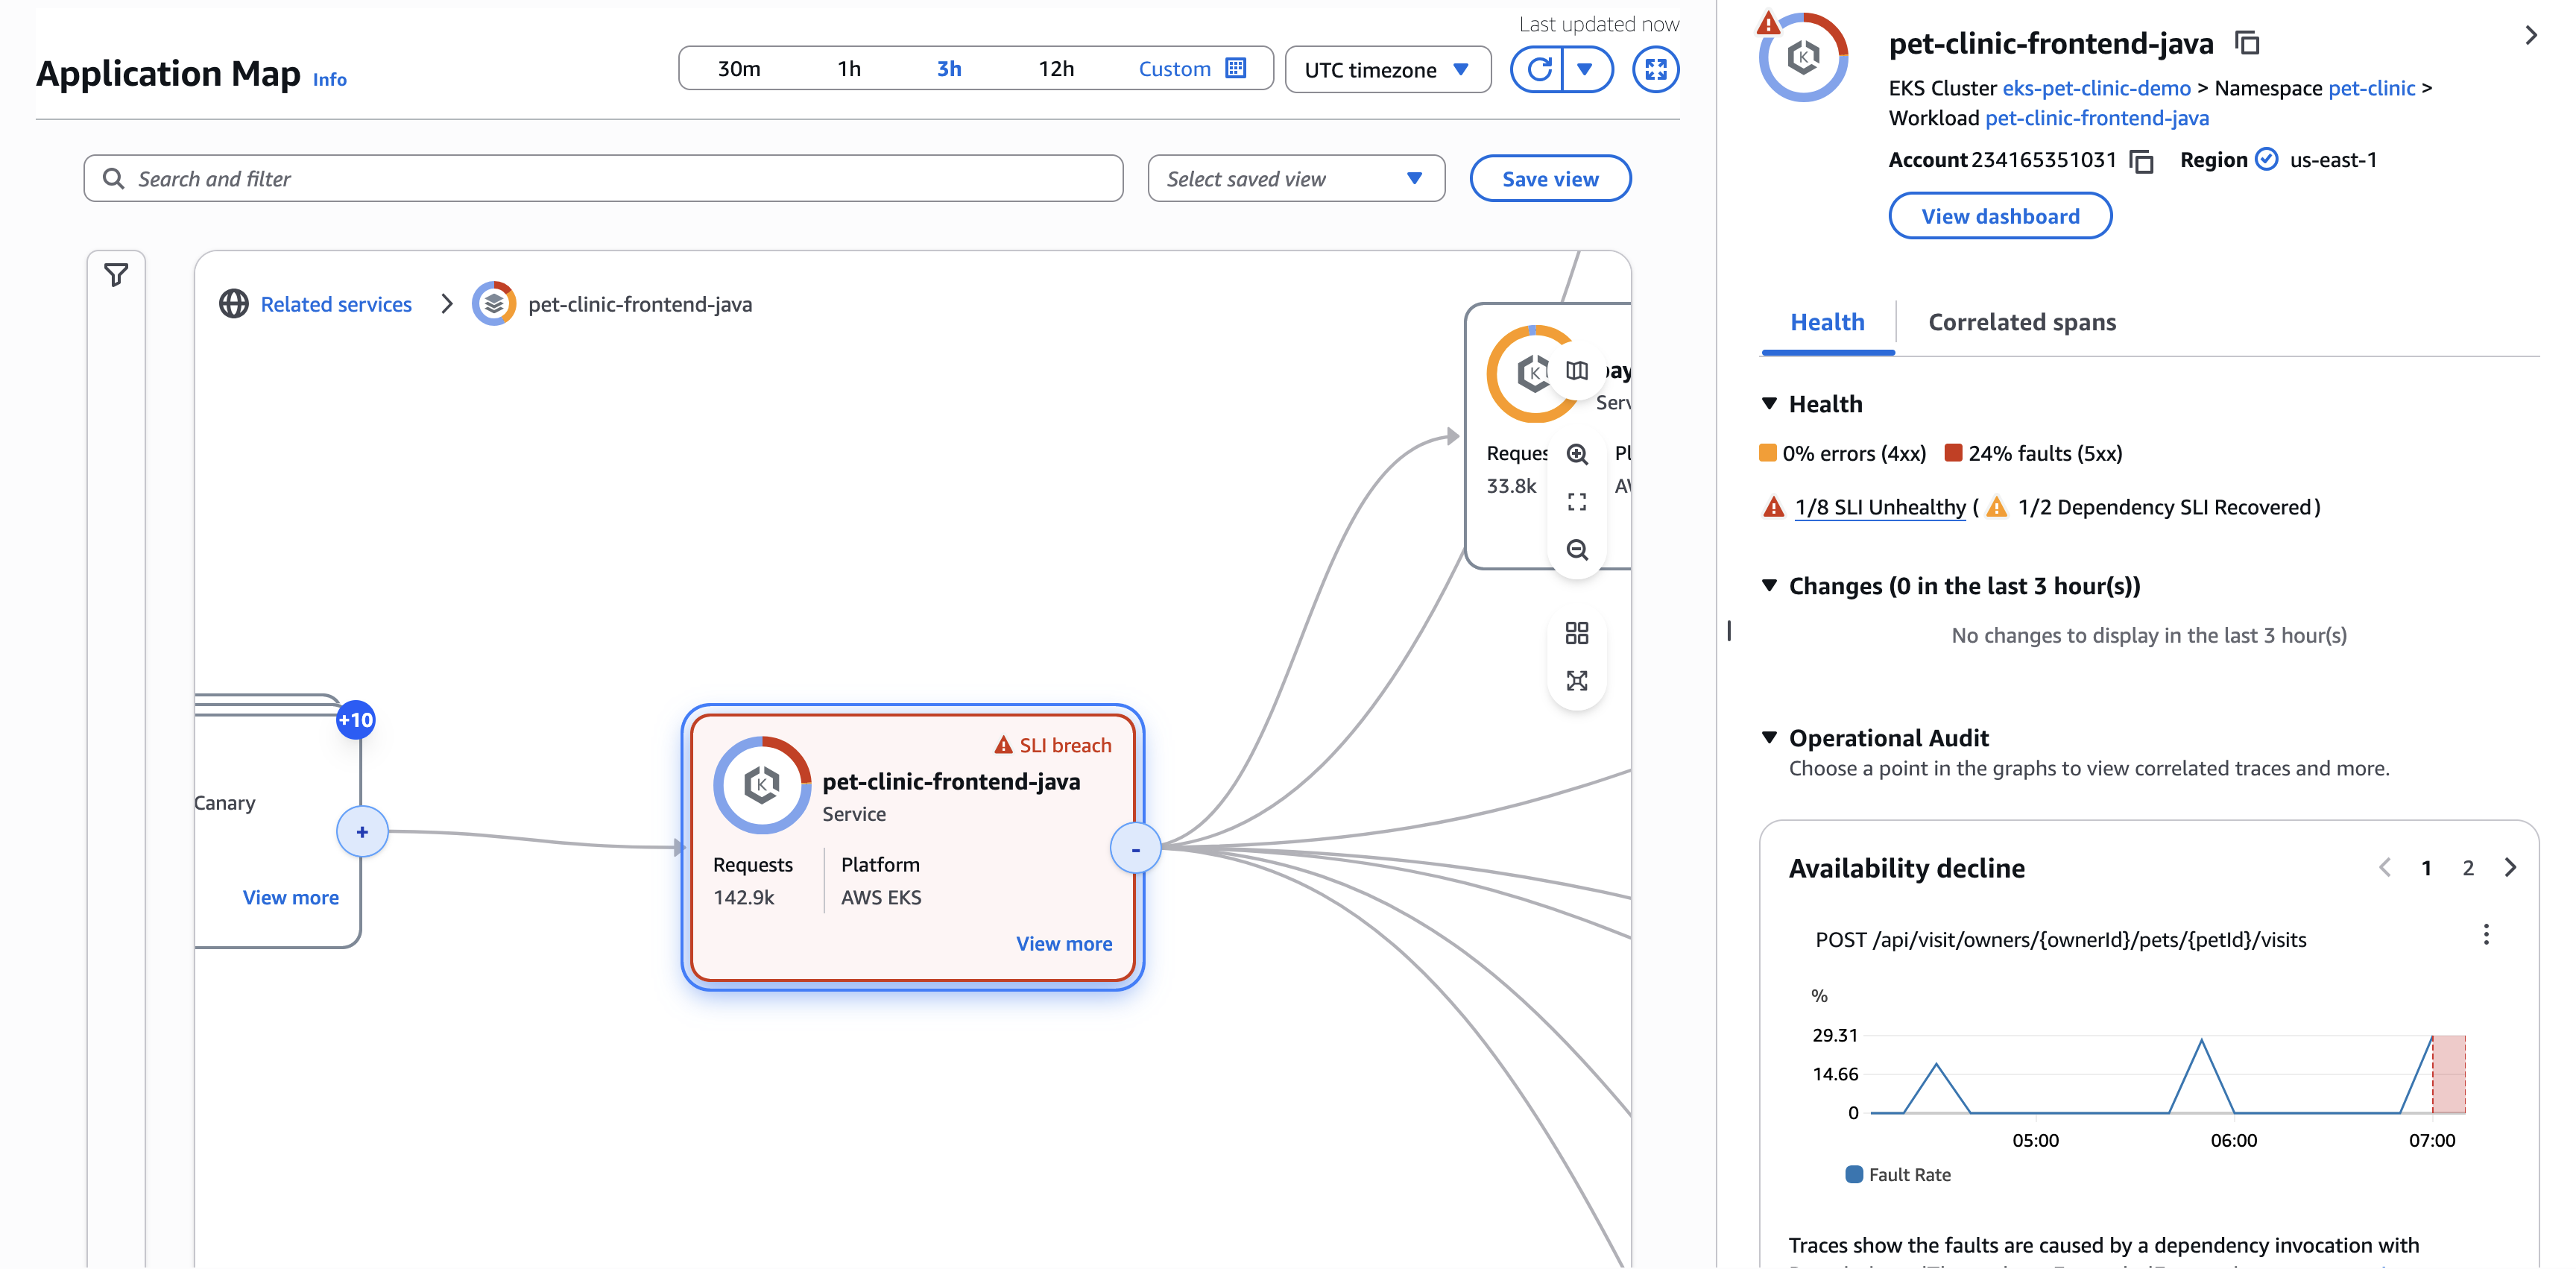
If you want to view service operation and other service detail, click on View dashboard to go to service overview page.
Alternatively you can click on Edge to view metrics of a specific dependency call of a service.
Change Events
Track change events across your application with Application Signals' automatic processing of CloudTrail events. Monitor configuration and deployment events for services and their dependencies, providing immediate context for operational analysis and troubleshooting. Change event detection is enabled alongside service discovery enablement through the CloudWatch Console or StartDiscovery API. For EKS services, deployment detection requires that the EKS services are instrumented with the Application Signals instrumentation SDK. Application Signals automatically correlates deployment times with performance changes, helping you quickly identify if recent deployments contributed to service issues. View change event history and impact across your services without additional configuration or setup requirements.
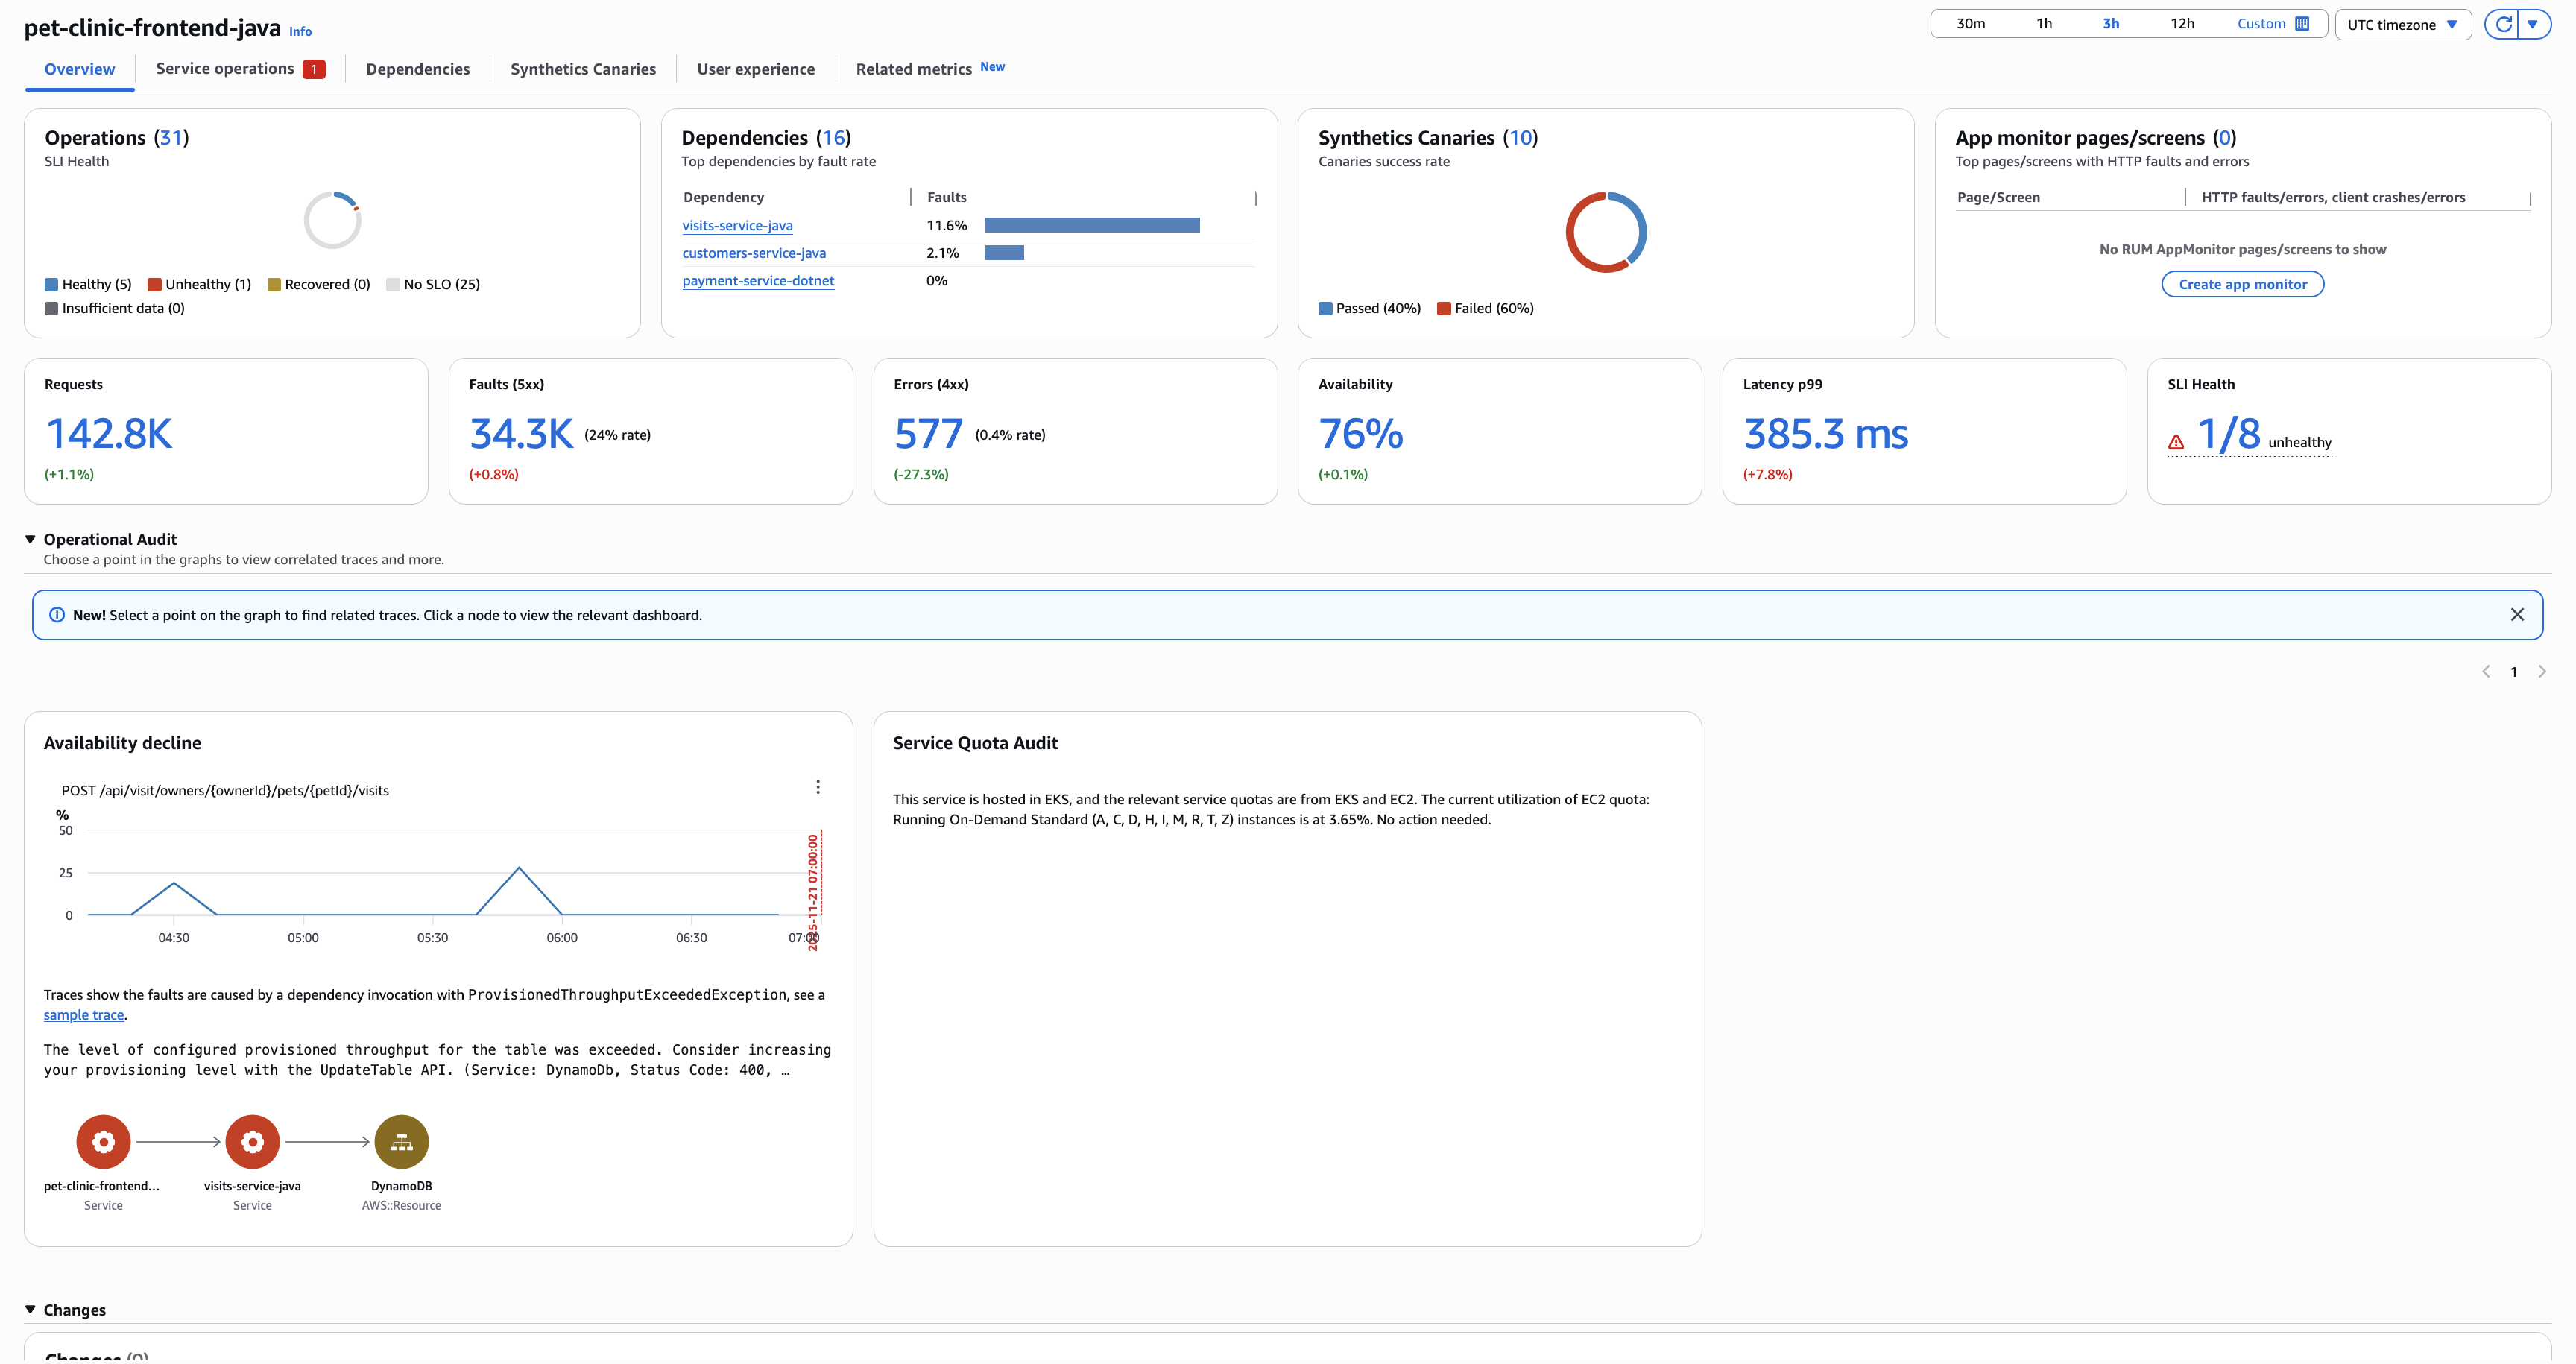
Audit findings
Discover critical insights through Application Signals' audit findings. The service analyzes your applications to report significant observations and potential problems, simplifying root cause analysis. These automated findings consolidate relevant traces, eliminating the need to navigate through multiple clicks. The audit system helps teams quickly identify issues and their underlying causes, enabling faster problem resolution.
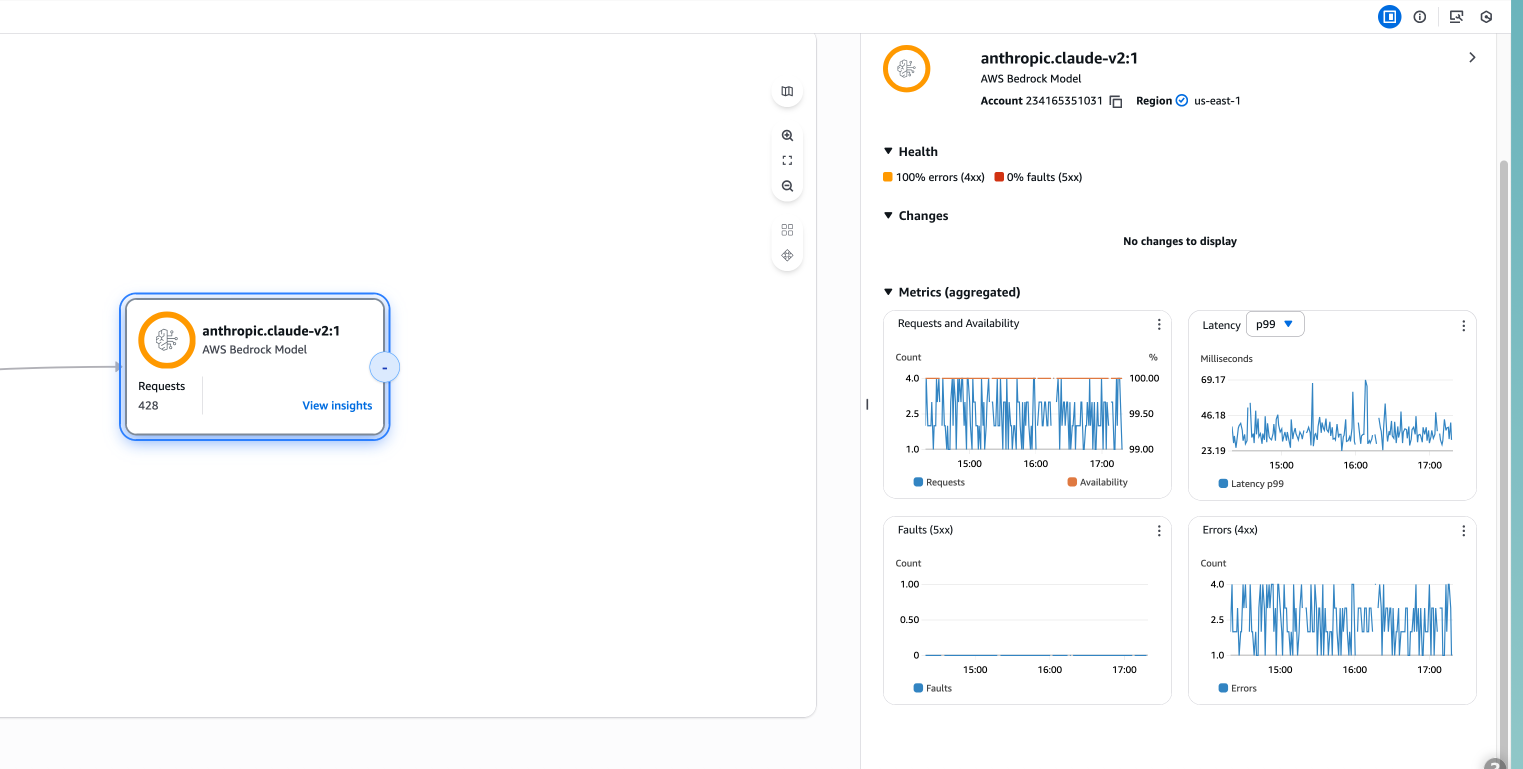
For services running on Amazon Bedrock, Application Signals automatically monitors GenAI token usage patterns. The audit system detects anomalies in input and output token consumption, comparing current usage against historical baselines. When token usage exceeds normal patterns, audit findings provide detailed analysis including token consumption trends, cost implications, and recommendations for optimization. This helps teams identify inefficient prompts, unexpected token spikes, and opportunities to reduce GenAI operational costs.
Cross-Account Observability on Application Map
Application Signals supports cross-account observability, allowing you to monitor and visualize services distributed across multiple Amazon accounts in a single unified application map. This capability is essential for organizations with multi-account architectures following Amazon best practices.
Key Capabilities:
Unified View: View services from multiple Amazon accounts in a single application map, providing a complete picture of your distributed application architecture.
Account Identification: Each service node clearly displays its account ID and region, making it easy to identify service ownership and location.
Centralized Monitoring: Monitor the health, performance, and SLO status of services across all connected accounts from a single monitoring account.
Cross-Account Filtering: Filter and group services by account ID to focus on specific accounts or view cross-account interactions.
How It Works:
Application Signals uses Amazon Organizations and cross-account sharing to enable observability across multiple accounts. To setup cross account observability please refer to CloudWatch cross-account observability.