View detailed service activity and operational health with the service detail page
When you instrument your application, Amazon CloudWatch Application Signals maps all of the services that your application discovers. Use the service detail page to see an overview of your services, operations, dependencies, canaries, and client requests for a single service. To view the service detail page, do the following:
-
Open the CloudWatch console
. -
Choose Services under the Application Signals section in the left navigation pane.
-
Choose the name of any service from the Services, Top services, or dependency tables.
Under schedule-visits, you will see the account label and ID under the service name.
The service detail page is organized into the following tabs:
-
Overview — Use this tab to see an overview of a single service, including the number of operations, dependencies, synthetics, and client pages. The tab shows key metrics for your entire service, top operations and dependencies. These metrics include time series data on latency, faults, and errors across all service operations for that service.
-
Service operations — Use this tab to see a list of the operations that your service calls and interactive graphs with key metrics that measure the health of each operation. You can select a data point in a graph to obtain information about traces, logs, or metrics associated with that data point.
-
Dependencies — Use this tab to see a list of dependencies that your service calls, and a list of metrics for those dependencies.
-
Synthetics canaries — Use this tab to see a list of synthetics canaries that simulate user calls to your service, and key performance metrics for how those canaries.
-
Client pages — Use this tab to see a list of client pages that call your service, and metrics that measure the quality of client interactions with your application.
-
Related metrics — Use this tab to correlate related metrics, such as standard metrics, runtime metrics, and custom metrics for a service, it's operations or dependencies.
View your service overview
Use the service overview page to view a high-level summary of metrics for all service operations in a single location. Check the performance of all the operations, dependencies, client pages and synthetics canaries that interact with your application. Use this information to help you determine where to focus efforts to identify issues, troubleshoot errors, and find opportunities for optimization.
Choose any link in Service Details to view information that is related to a specific service. For example, for services hosted in Amazon EKS, the service details page shows Cluster, Namespace, and Workload information. For services hosted in Amazon ECS or Amazon EC2, the service details page shows the Environment value.
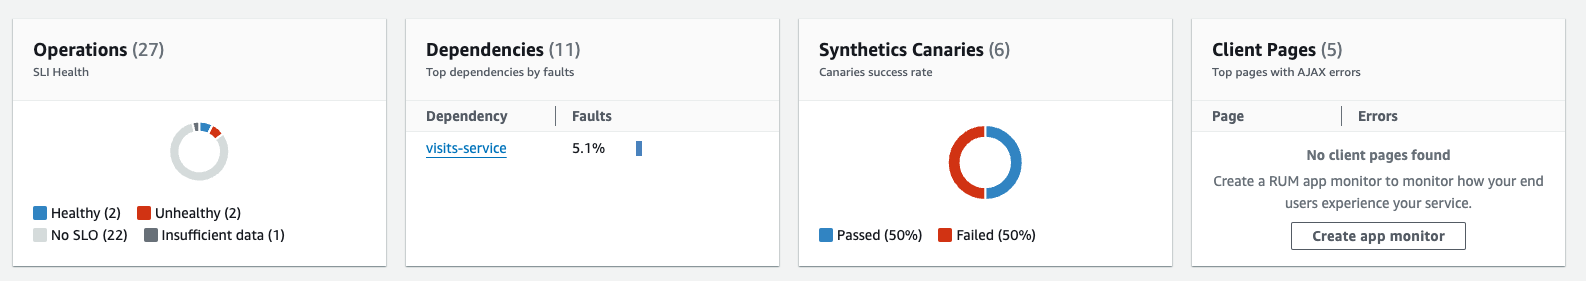
Under Services, the Overview tab displays a summary of the following:
-
Operations – Use this tab to see the health of your service operations. The health status is determined by service level indicators (SLI) that are defined as a part of a service level objective (SLO).
-
Dependencies – Use this tab to see the top dependencies of the services called by your application, listed by fault rate and to see the health of your service dependencies. The health status is determined by service level indicators (SLI) that are defined as a part of a service level objective (SLO).
-
Synthetics canaries – Use this tab to see the result of simulated calls to endpoints or APIs associated with your service, and the number of failed canaries.
-
Client pages – Use this tab to see top pages called by clients that have asynchronous JavaScript and XML (AJAX) errors.
The following illustration shows an overview of your services:
The Overview tab also displays a graph of dependencies with the highest latency across all services. Use the p99, p90 and p50 latency metrics to quickly assess which dependencies are contributing to your total service latency, as follows:
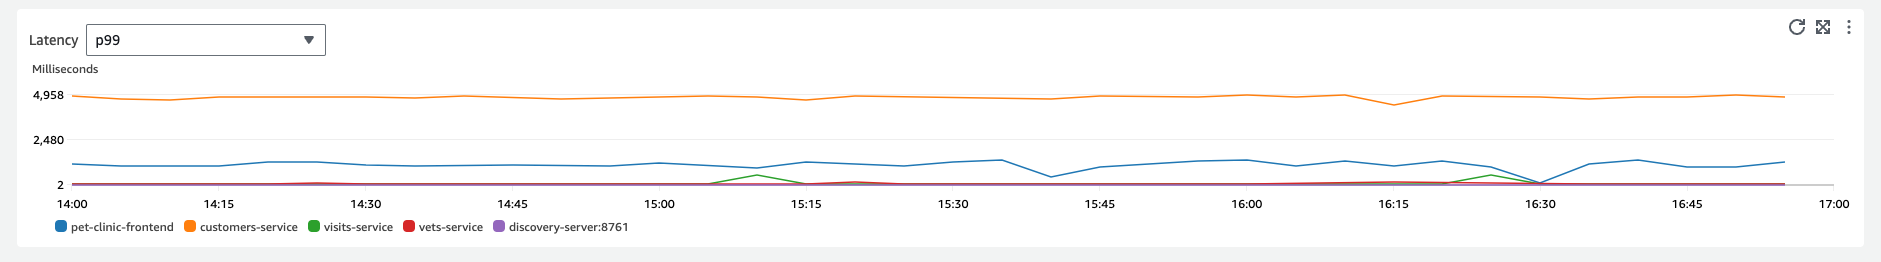
For example, the previous graph shows that 99% of the requests made to the customer-service dependency were completed in approximately 4,950 milliseconds. The other dependencies took less time.
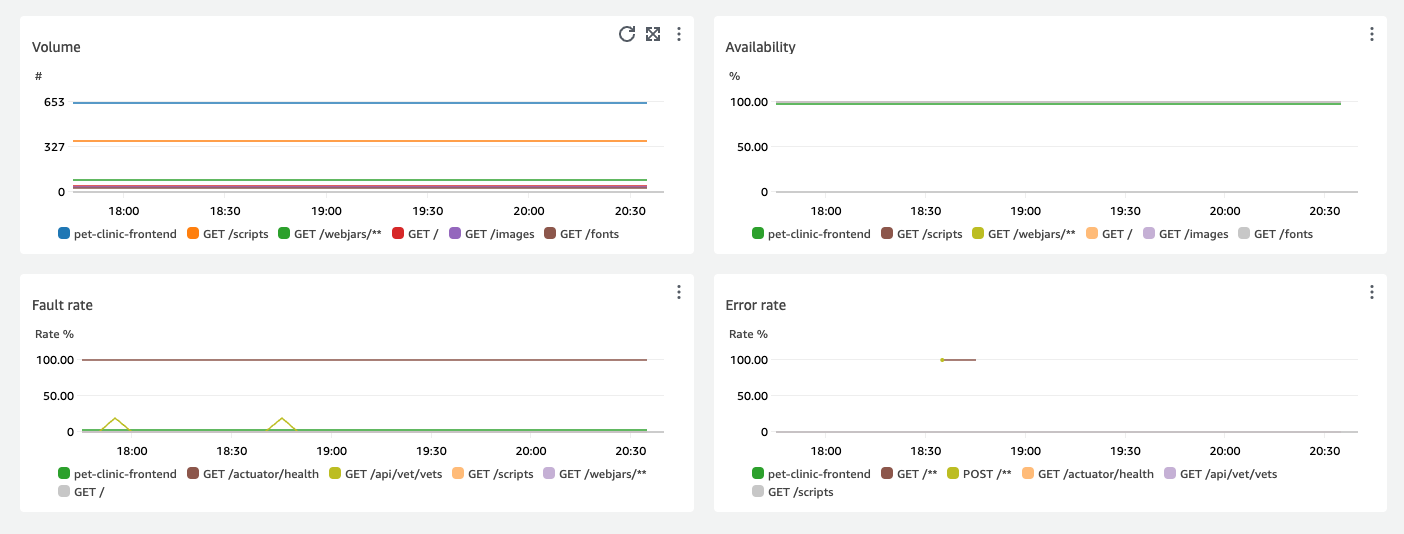
Graphs displaying the top four service operations by latency show the volume of requests, availability, fault rate, and error rate for those services, as shown in the following image:
The Service details section displays the details of the service including the Account ID and Account label.
View your service operations
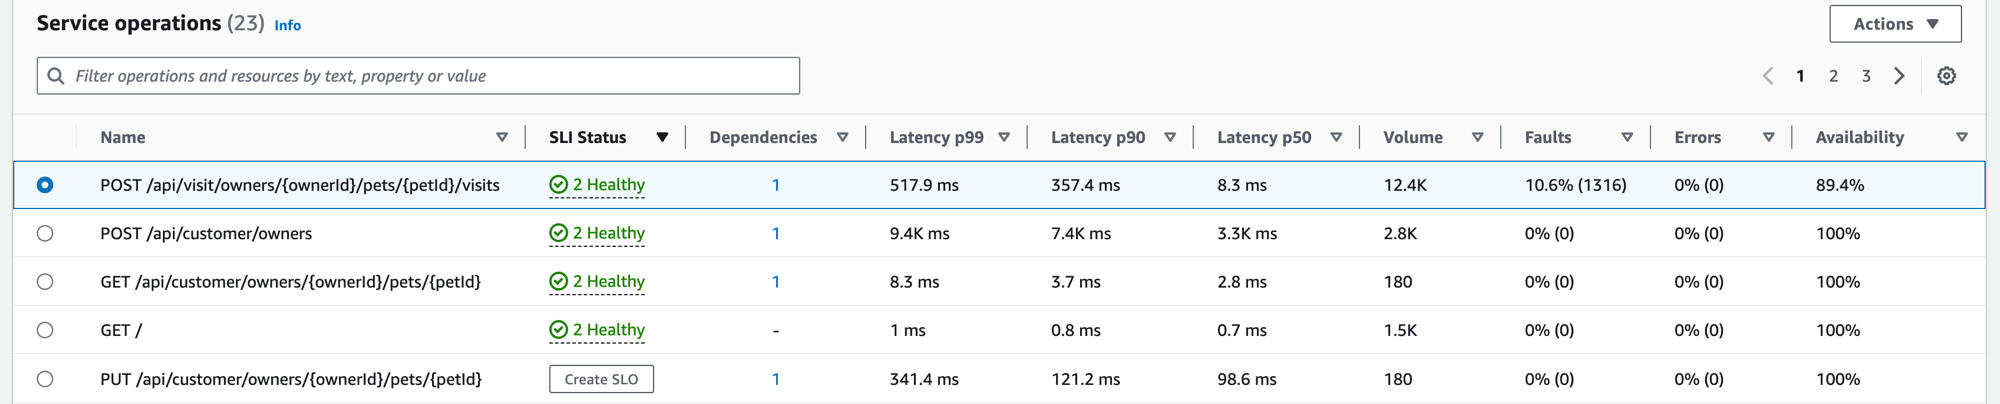
When you instrument your application, Application Signals discovers all of the service operations that your application calls. Use the Service operations tab to see a table that contains the service operations and a set of metrics that measure the performance of a selected operation. These metrics include SLI status, number of dependencies, latency, volume, faults, errors, and availability, as shown in the following image:
Filter the table to make it easier to find a service operation by choosing one or more properties from the filter text box. As you choose each property, you are guided through filter criteria and will see the complete filter below the filter text box. Choose Clear filters at any time to remove the table filter.
Choose the SLI status for an operation to display a popup containing a link to any unhealthy SLI, and a link to see all SLOs for the operation, as shown in the following table:
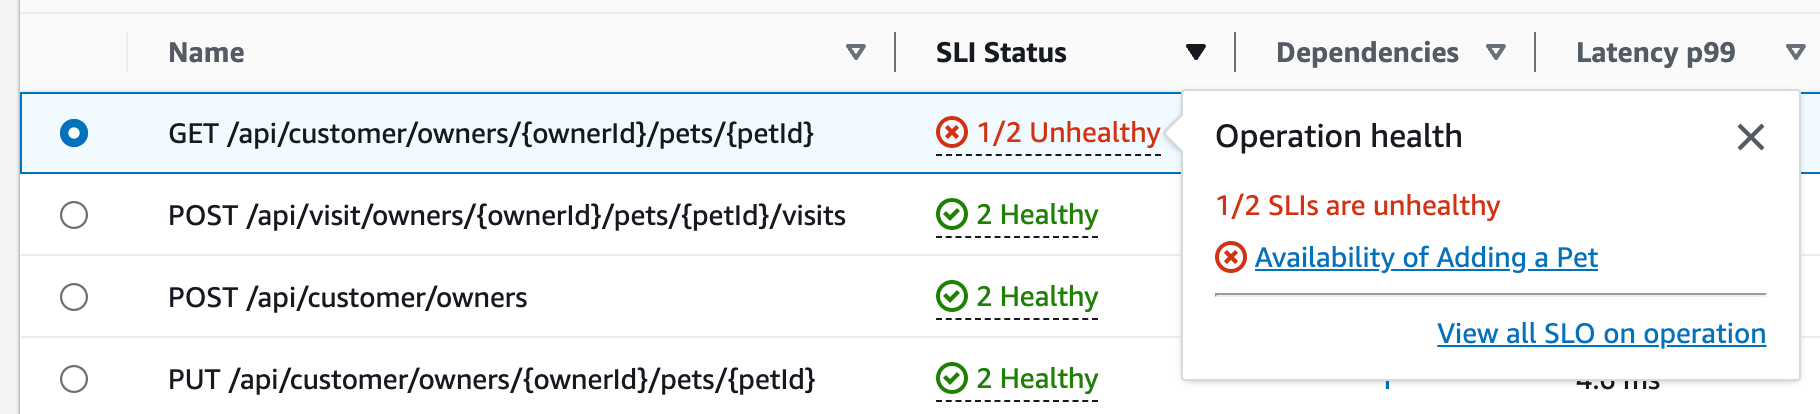
The service operations table lists the SLI status, the number of healthy or unhealthy SLIs, and the total number of SLOs for each operation.
Use SLIs to monitor latency, availability, and other operational metrics that measure the operational health of a service. Use an SLO to check the performance and health status of your services and operations.
To create an SLO, do the following:
-
If an operation does not have an SLO, choose the Create SLO button within the SLI Status column.
-
If an operation already has an SLO, do the following:
-
Select the radio button next to the operation name.
-
Choose Create SLO from the Actions down arrow at the top right of the table.
-
For more information, see service level objectives (SLOs).
The Dependencies column shows the number of dependencies this operation calls. Choose this number to open the Dependencies tab filtered to the selected operation.
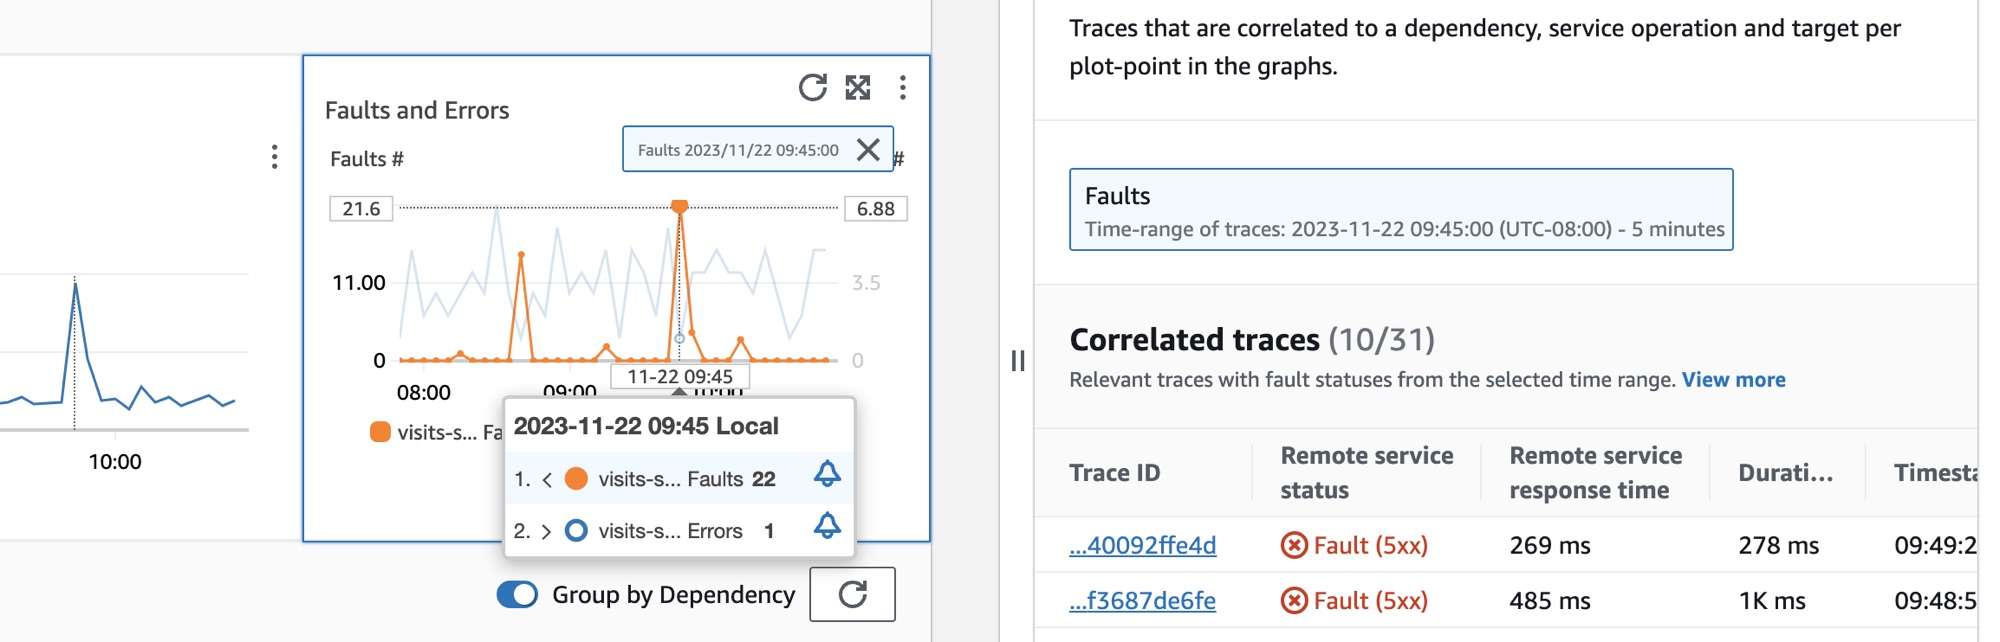
View service operations metrics, correlated traces, and application logs
Application Signals correlates service operation metrics with Amazon X-Ray traces, CloudWatch Container Insights, and application logs. Use these metrics to troubleshoot operational health issues. To view metrics as graphical information, do the following:
-
Select a service operation in the Service operations table to see a set of graphs for the selected operation above the table with metrics for Volume and Availability, Latency, and Faults and Errors.
-
Hover over a point in a graph to view more information.
-
Select a point to open a diagnostic pane that shows correlated traces, metrics, and application logs for the selected point in the graph.
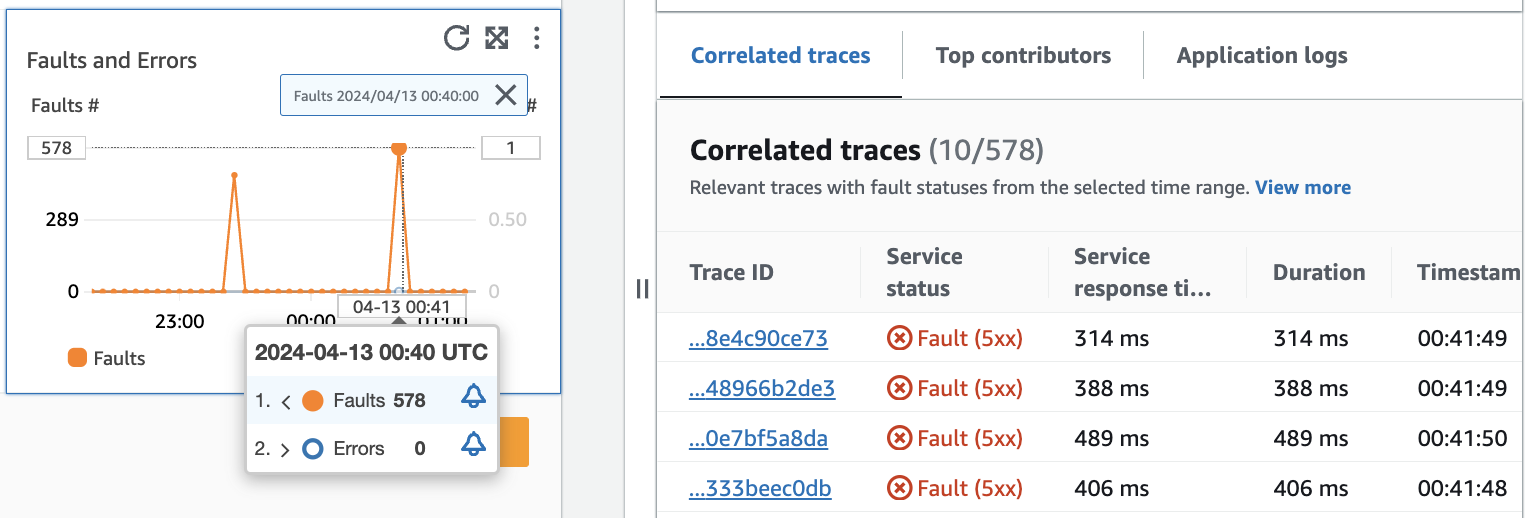
The following image shows the tooltip that appears after hovering over a point in the graph, and the diagnostic pane which appears after clicking on a point. The tooltip contains information about the associated data point in the Faults and Errors graph. The pane contains Correlated traces, Top contributors, and Application logs associated with the selected point.
Correlated traces
Look at related traces to understand an underlying issue with a trace. You can check to see if correlated traces or any service nodes associated with them behave similarly. To examine correlated traces, choose a Trace ID from the Correlated traces table to open the X-Ray trace details page for the chosen trace. The trace details page contains a map of service nodes that are associated with the selected trace and a timeline of trace segments.
Top contributors
View the top contributors to find main input sources to a metric. Group contributors by different components to look for similarities within the group and understand how trace behavior differs between them.
The Top contributors tab gives metrics for Call volume, Availability, Avg latency, Errors, and Faults for each group. The following example image shows top contributors to a suite of metrics for an application deployed on an Amazon EKS platform:
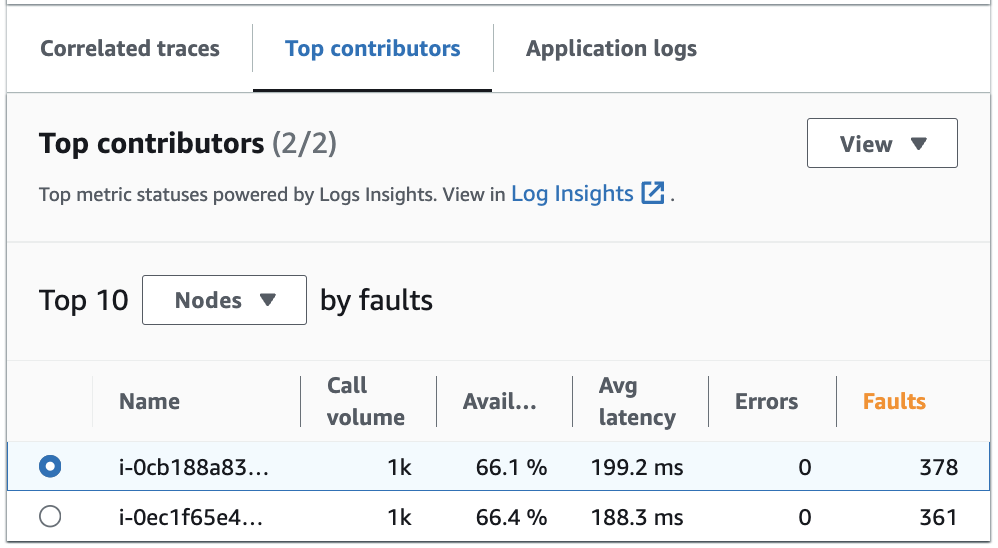
The top contributors contains the following metrics:
-
Call volume - Use the call volume to understand the number of requests per time interval for a group.
-
Availability - Use availability to see what percentage of time that no faults were detected for a group.
-
Avg latency - Use latency to check the average time that requests ran for a group over a time interval that depends on how long ago the requests that you are investigating were made. Requests that were made less than 15 days prior are evaluated over 1 minute intervals. Requests that were made between 15 and 30 days prior, inclusive, are evaluated over 5 minute intervals. For example, if you are investigating requests that caused a fault 15 days ago, the call volume metric is equal to the number of requests per 5 minute interval.
-
Errors - The number of errors per group measured over a time interval.
-
Faults - The number of faults per group over a time interval.
Top contributors using Amazon EKS or Kubernetes
Use information about the top contributors for applications deployed on Amazon EKS or Kubernetesto see operational health metrics grouped by Node, Pod and PodTemplateHash. The following definitions apply:
-
A pod is a group of one or more Docker containers that share storage and resources. A pod is the smallest unit that can be deployed on a Kubernetes platform. Group by pods to check if errors are related to pod-specific limitations.
-
A node is a server that runs pods. Group by nodes to check if errors are related to node-specific limitations.
-
A pod template hash is used to find a particular version of a deployment. Group by pod template hash to check if errors are related to a particular deployment.
Top contributors using Amazon EC2
Use information about the top contributors for applications deployed on Amazon EKS to see operational health metrics grouped by instance ID, and auto scaling group. The following definitions apply:
-
An Instance ID is a unique identifier for the Amazon EC2 instance that your service runs. Group by instance ID to check if errors are related to a specific Amazon EC2 instance.
-
An auto scaling group is a collection of Amazon EC2 instances that allow you to scale up or down the resources you need to serve your application requests. Group by auto scaling group if you want to check if errors are limited in scope to the instances inside the group.
Top contributors using a custom platform
Use information about the top contributors for applications deployed using custom instrumentation to see operational health metrics grouped by Host name. The following definitions apply:
-
A host name identifies a device such as an endpoint or Amazon EC2 instance that is connected to a network. Group by host name to check if your errors are related to a specific physical or virtual device.
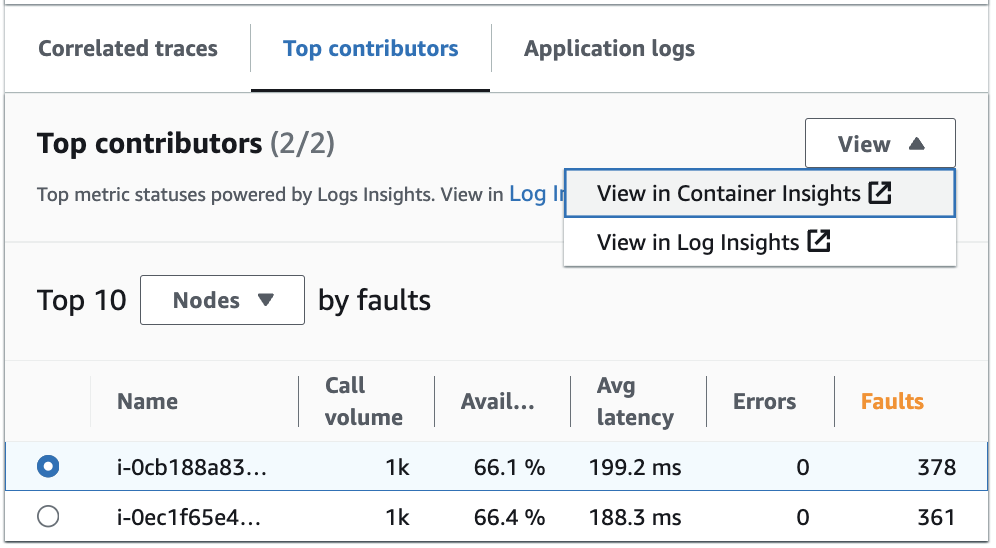
View top contributors in Log Insights and Container Insights
View and modify the automatic query that generated metrics for your top contributors in Log Insights. View infrastructure performance metrics by specific groups such as pods or nodes in Container Insights. You can sort clusters, nodes or workloads by resource consumption and quickly identify anomalies or and mitigate risks pro-actively before end user experience is impacted. An image showing how to select these options follows:
In Container Insights, you can view metrics for your Amazon EKS or Amazon ECS container that are specific to the grouping of your top contributors. For example, if you grouped by pod for an EKS container to generate top contributors, container insights will show metrics and statistics filtered for your pod.
In Log Insights, you can modify the query that generated the metrics under Top contributors using the following steps:
-
Select View in Log Insights. The Logs Insights page that opens contains an query that is automatically generated and contains the following information:
-
The log cluster group name.
-
The operation that you were investigating with CloudWatch.
-
The aggregate of the operational health metric interacted with on the graph.
The log results are automatically filtered to show data from the last five minutes before you selected the data point on the service graph.
-
-
To edit the query, replace the generated text with your changes. You can also use the Query generator to help you generate a new query, or update the existing query.
Application logs
Use the query in the Application logs tab to generate logged information for your current log group, service and insert a timestamp. A log group is a group of log streams that you can define when you configure your application.
Use a log group to organize logs with similar characteristics including the following:
-
Capture logs from a specific organization, source or function.
-
Capture logs that are accessed by a particular user.
-
Capture logs for a specific time period.
Use these log streams to track specific groups or time frames. You can also set up monitoring rules, alarms and notifications for these log groups. For more information about log groups, see Working with log groups and log streams.
The application logs query returns the logs, recurring text patterns and graphical visualizations for your log groups.
To run the query, select Run query in Logs Insights to either run the automatically generated query or modify the query. To edit the query, replace the automatically generated text with your changes. You can also use the Query generator to help you generate a new query or update the existing query.
The following image shows the sample query that is automatically generated based on the selected point in the service operations graph:
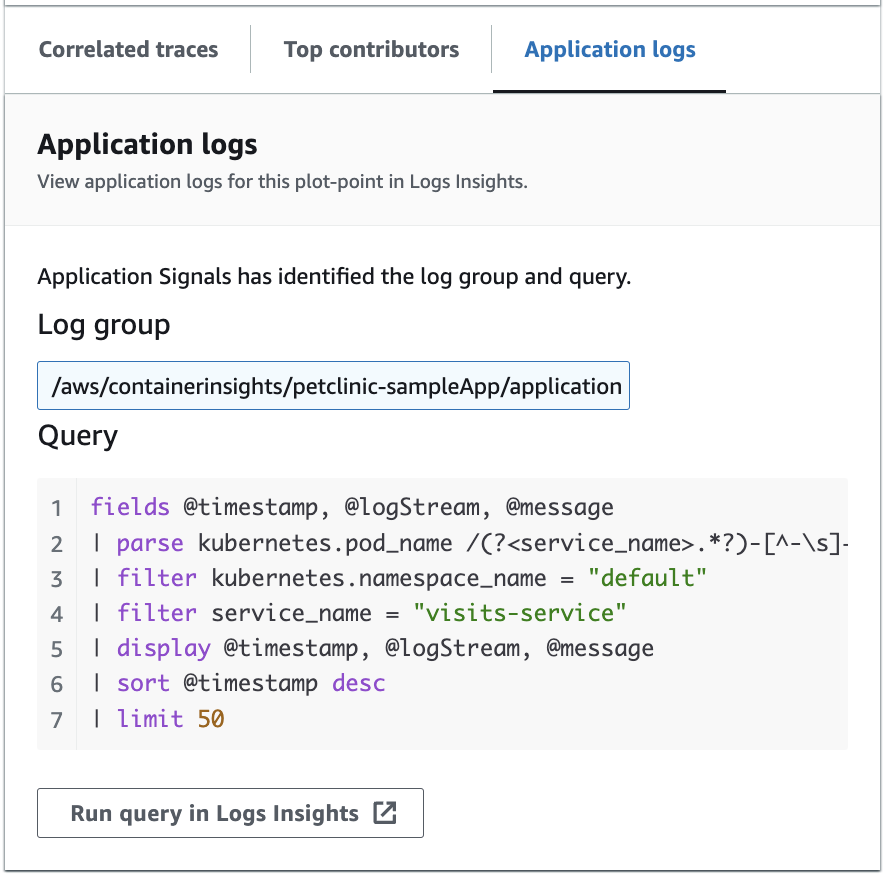
In the preceding image, CloudWatch has automatically detected the log group that is associated with your selected point, and included it in a generated query.
View your service dependencies
Choose the Dependencies tab to display the Dependencies table and a set of metrics for the dependencies of all service operations or a single operation. The table contains a list of dependencies discovered by Application Signals, including metrics for SLI status, latency, call volume, fault rate, error rate, and availability.
At the top of the page, choose an operation from the down arrow list to view its dependencies, or choose All to see dependencies for all operations.
Filter the table to make it easier to find what you're looking for, by choosing one or more properties from the filter text box. As you choose each property, you are guided through filter criteria and will see the complete filter below the filter text box. Choose Clear filters at any time to remove the table filter. Select Group by Dependency at the top right of the table to group dependencies by service and operation name. When grouping is turned on, expand or collapse a group of dependencies with the + icon next to the dependency name.
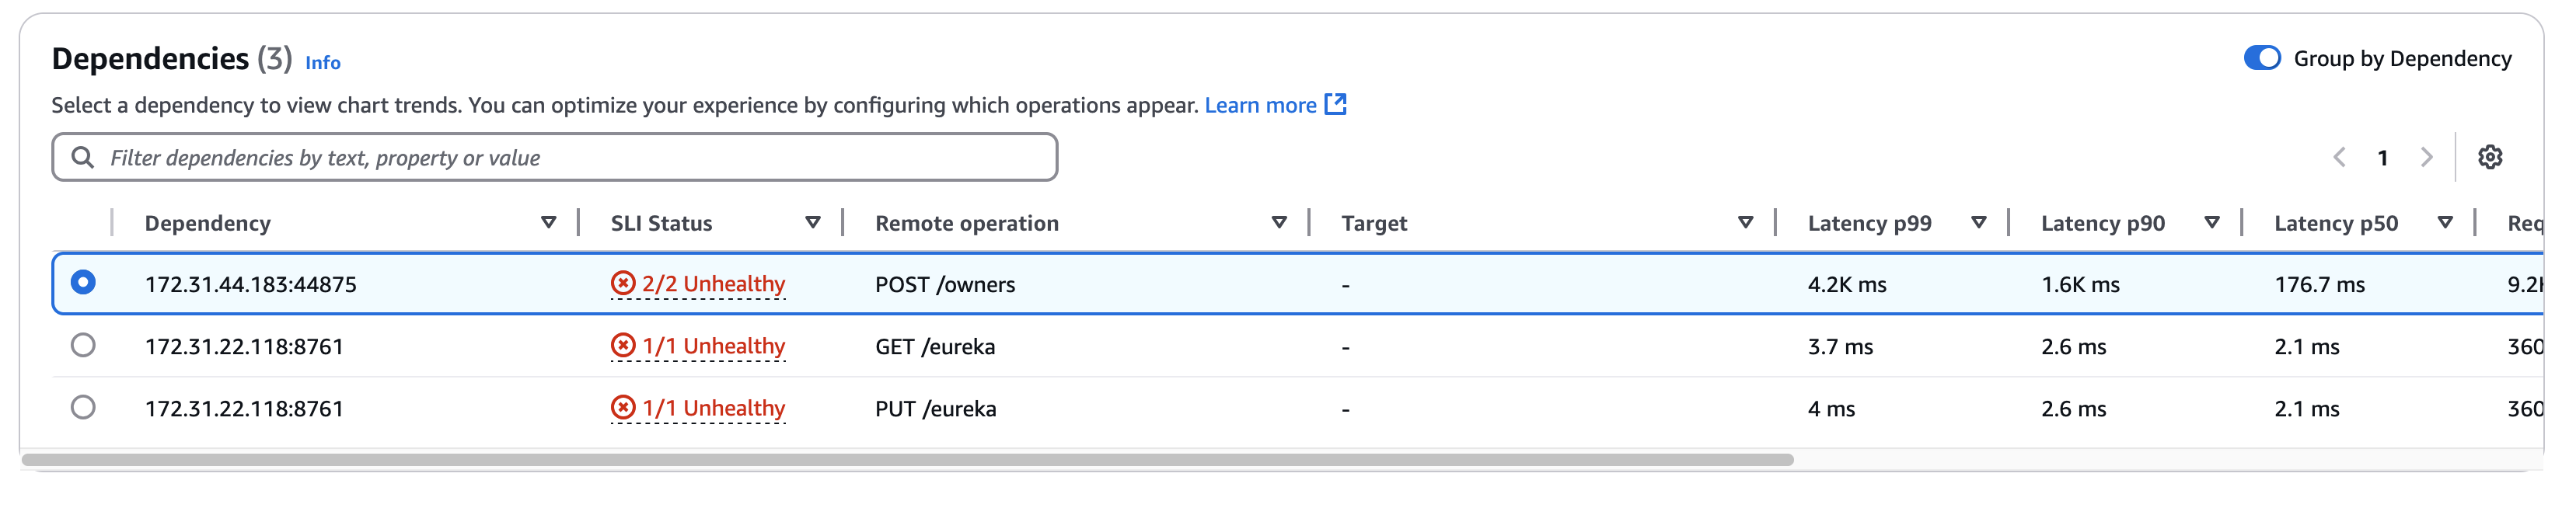
The Dependency column displays the dependency service name, while the Remote Operation column displays the service operation name. The SLI status column displays the number of healthy or unhealthy SLIs along with the total number of SLIs for each dependency. When calling Amazon services, the Target column displays the Amazon resource, such as DynamoDB table or Amazon SNS queue.
To select a dependency, select the option next to a dependency in the Dependencies table. This shows a set of graphs that display detailed metrics for call volume, availability, faults, and errors. Hover over a point in a graph to see a popup containing more information. Select a point in a graph to open a diagnostic pane that shows correlated traces for the selected point in the graph. Choose a trace ID from the Correlated traces table to open the X-Ray Trace details page for the selected trace.
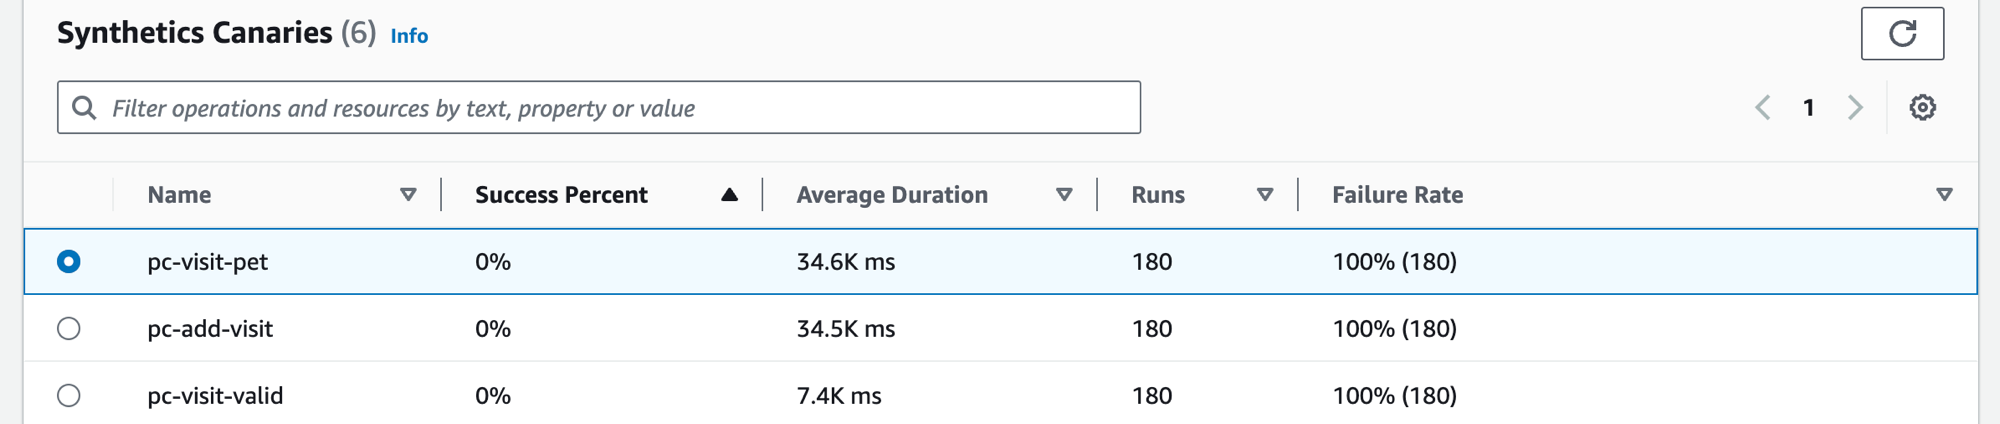
View your Synthetics canaries
Choose the Synthetics Canaries tab to display the Synthetics Canaries table, and a set of metrics for each canary in the table. The table includes metrics for success percentage, average duration, runs, and failure rate. Only canaries that are enabled for Amazon X-Ray tracing are displayed.
Use the filter text box in the synthetics canaries table to find the canary that you are interested in. Each filter that you create appears below the filter text box. Choose Clear filters at any time to remove the table filter.
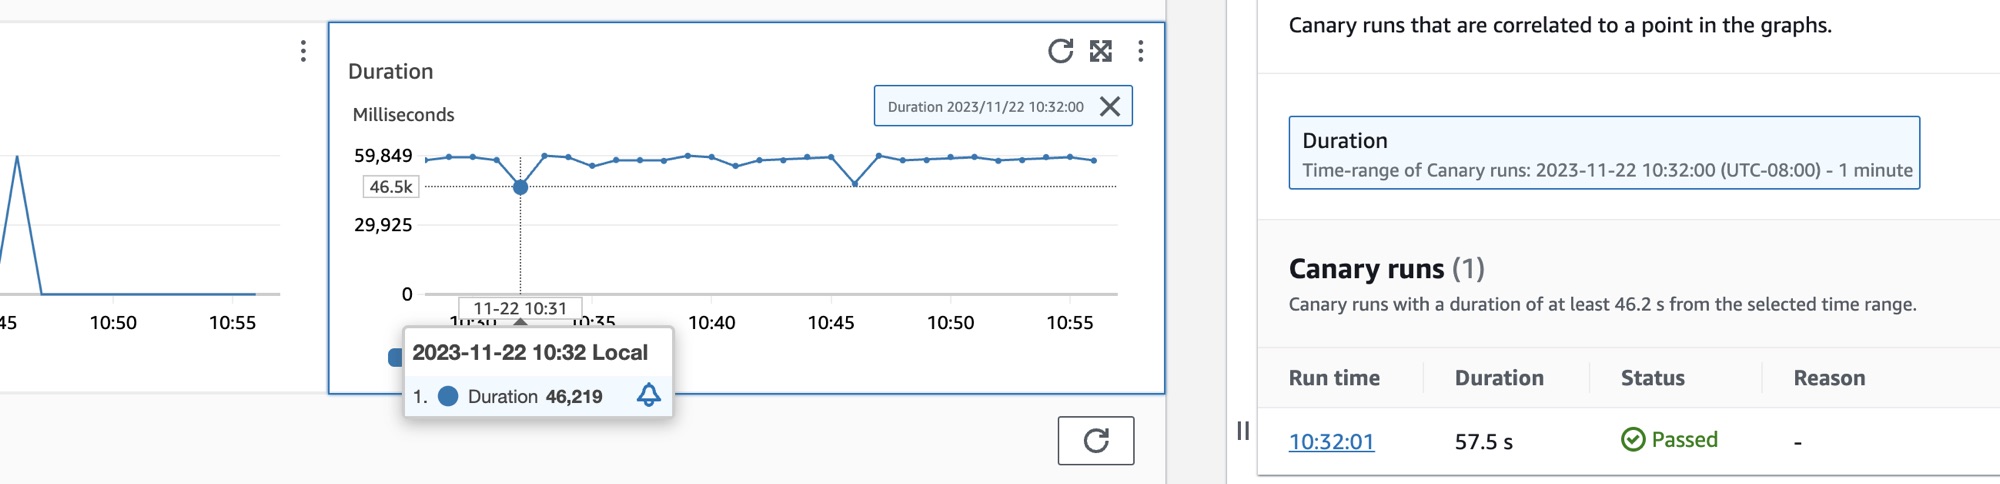
Select the radio button next to the name of the canary to see a set of tabs containing graphs detailed metrics including success percentage, errors and duration. Hover over a point in a graph to see a popup containing more information. Select a point in a graph to open a diagnostic pane that shows canary runs that correlate to the selected point. Select a canary run and choose the Run time to see artifacts for your selected canary run including logs, HTTP Archive (HAR) files, screenshots, and suggested steps to help you troubleshoot problems. Choose Larn more to open the CloudWatch Synthetics Canaries page next to Canary runs.
View your client pages
Choose the Client pages tab to display a list of client web pages that call your service. Use the set of metrics for the selected client page to measure the quality of your client's experience when interacting with a service or application. These metrics include page loads, web vitals, and errors.
To display your client pages in the table, you must configure your CloudWatch RUM web client for X-Ray tracing and turn on Application Signals metrics for your client pages. Choose Manage pages to select which pages are enabled for Application Signals metrics.
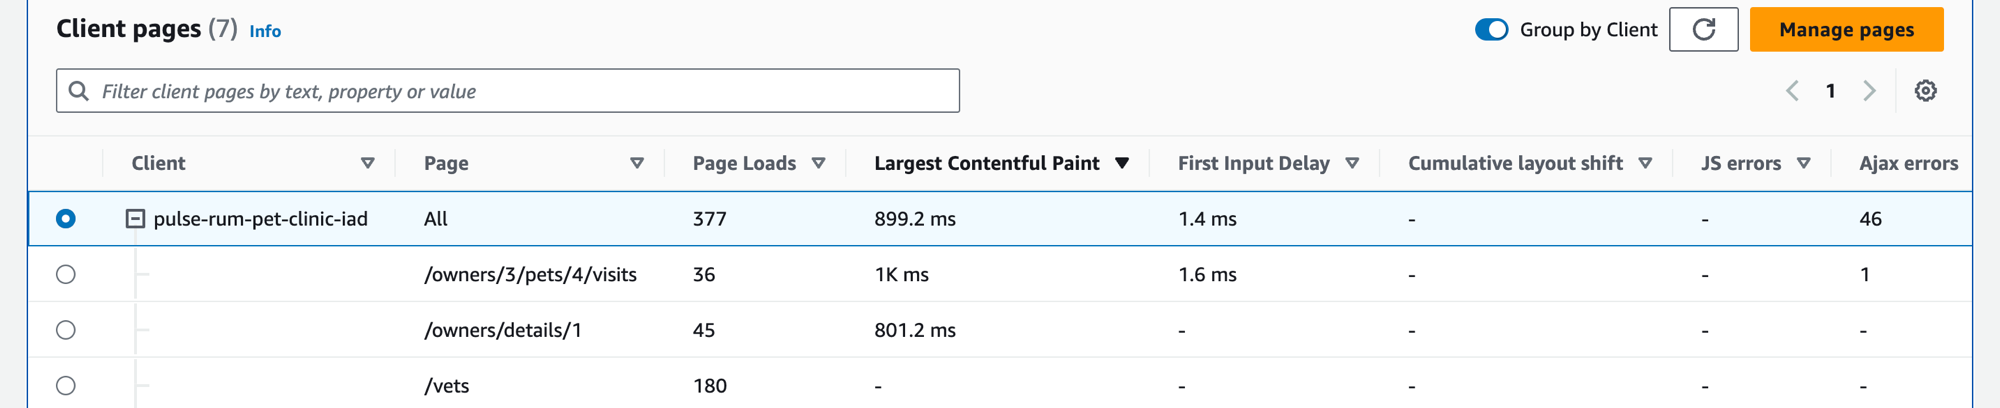
Use the filter text box to find the client page or application monitor that you are interested in below the filter text box. Choose Clear filters to remove the table filter. Select Group by Client to group client pages by client. When grouped, choose the + icon next to a client name to expand the row and see all pages for that client.
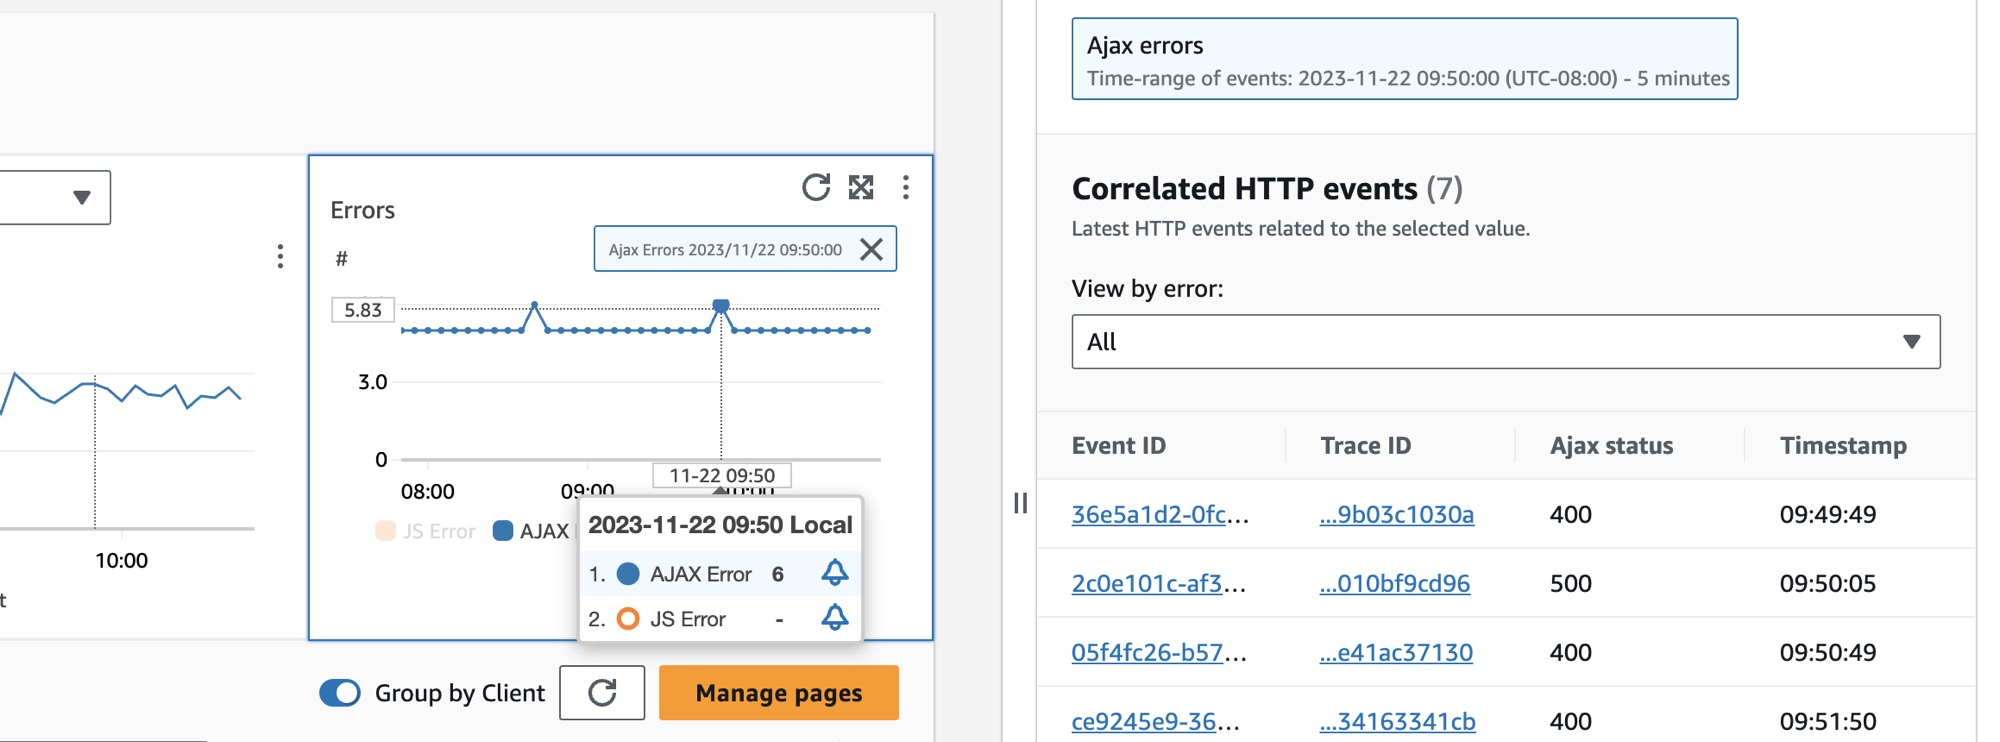
To select a client page, select the option next to a client page in the Client pages table. You will see a set of graphs that display detailed metrics. Hover over a point in a graph to see a popup containing more information. Select a point in a graph to open a diagnostic pane that shows correlated performance navigation events for the selected point in the graph. Choose an event ID from the list of navigation events to open the CloudWatch RUM Page view for the chosen event.
Note
To see AJAX errors within your client pages, use the CloudWatch RUM web client version 1.15 or newer.
Up to 100 operations, canaries, and client pages, and up to 250 dependencies, can be shown per service.
View Related metrics
Use the Related metrics tab to visualize multiple metrics, identify correlation patterns, and determine root causes of issues.
The metrics table shows three types of metrics:
Standard metrics – Application Signals collects standard application metrics from the services that it discovers. For more information, see Standard application metrics collected
Runtime metrics – Application Signals uses the Amazon Distro for OpenTelemetry SDK to automatically collect OpenTelemetry-compatible metrics from your Java and Python applications. For more information, see Rumtime metrics
Custom metrics – Application Signals enables you to generate custom metrics from your application. For more information, see Custom metrics with Application Signals
You can access the Related metrics tab from Service Overview, Service Operations, Dependencies, Synthetics canaries, or RUM tabs.
-
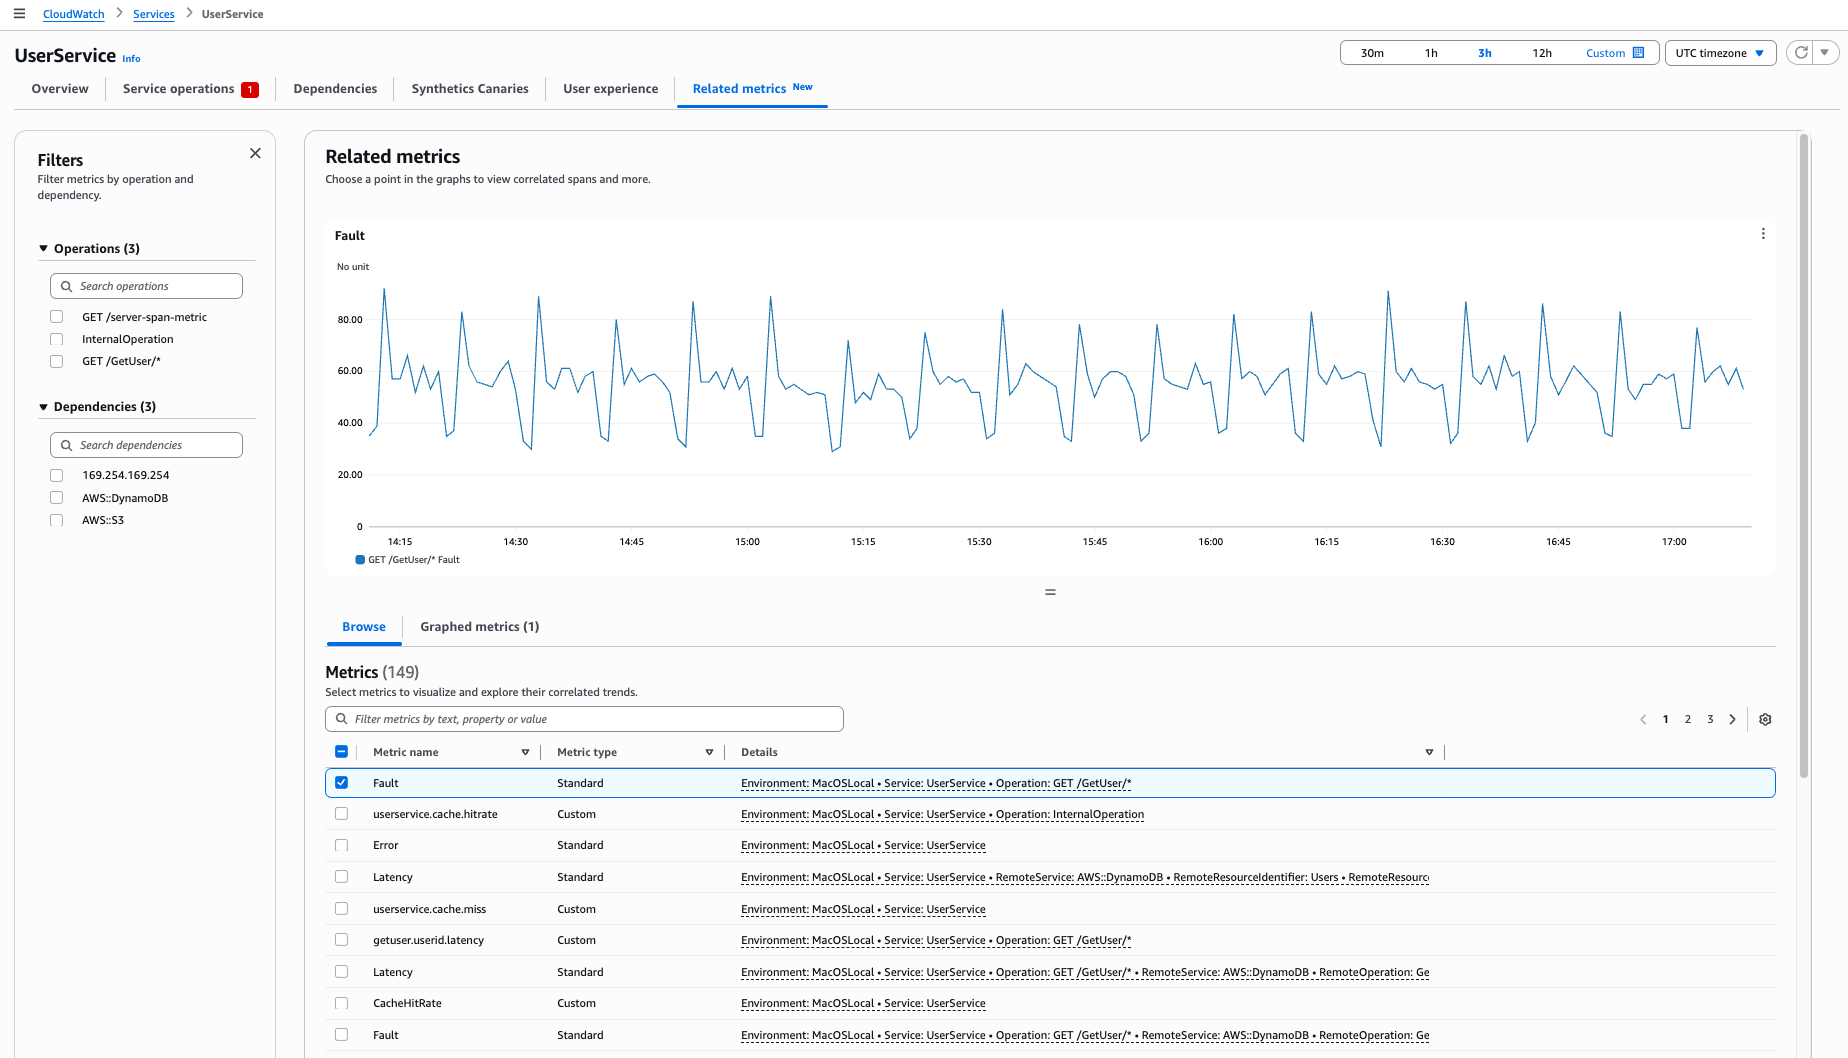
The left navigation panel starts with all operations and dependencies unselected
-
The graph initially shows the Fault metric from the operation with the highest fault rate
Before you begin correlation analysis, make sure you have data points visible in Service Operations or Dependencies. To analyze correlations:
Open the Service Operations or Dependencies page.
Select a data point on any graph.
In the right-panel, choose Correlate with Other Metrics.
On the Related metrics tab that opens, you'll see:
Your selected operation or dependency in the left navigation
Your selected metric graphed in the Browse metrics table
Correlated spans when you select a data point
To graph multiple metrics, select one or more metrics from the Browse view in the Related metrics tab. Choose Graphed Metrics to view all graphed metrics.
To filter metrics, use the left panel filters to focus on specific operations or dependencies and use the table header filter bar to search by name, type, or other attributes. These filtering options help you detect patterns and troubleshoot issues more efficiently.
To analyze related metrics in detail, select a data point in the Related metrics tab. You can then view:
Top Contributors – Analyzes metrics by running CloudWatch Logs Insights queries. These queries process Enhanced Metrics Format (EMF) records that contain key attributes for detailed analysis for the following:
Latency measurements
Fault occurrences
Service availability metrics
The following metrics do not support Top Contributors:
OTEL Metrics
Server-side Span Metrics
You can view Top Contributors for RED Metrics and Client-side Span Metrics.
Correlated Spans – The Correlated Spans section works consistently with the Service Operations tab. To help you identify related traces and metrics, the correlation mechanism works by:
Comparing metric names with span attributes
Identifying matching patterns during the selected time period
Displaying relevant trace information
To effectively analyze your metrics and spans together, you need to understand how different metric types correlate. Here are the key limitations:
OTEL Metrics don't correlate with spans because they use independent naming systems
To correlate Server or Client-side Span Metrics with spans:
Include a Service dimension field in your configuration
Without this Service dimension, you cannot correlate these metrics with spans
Log Applications – For information on log application, see Application logs