Viewing the Database Instance Dashboard for CloudWatch Database Insights
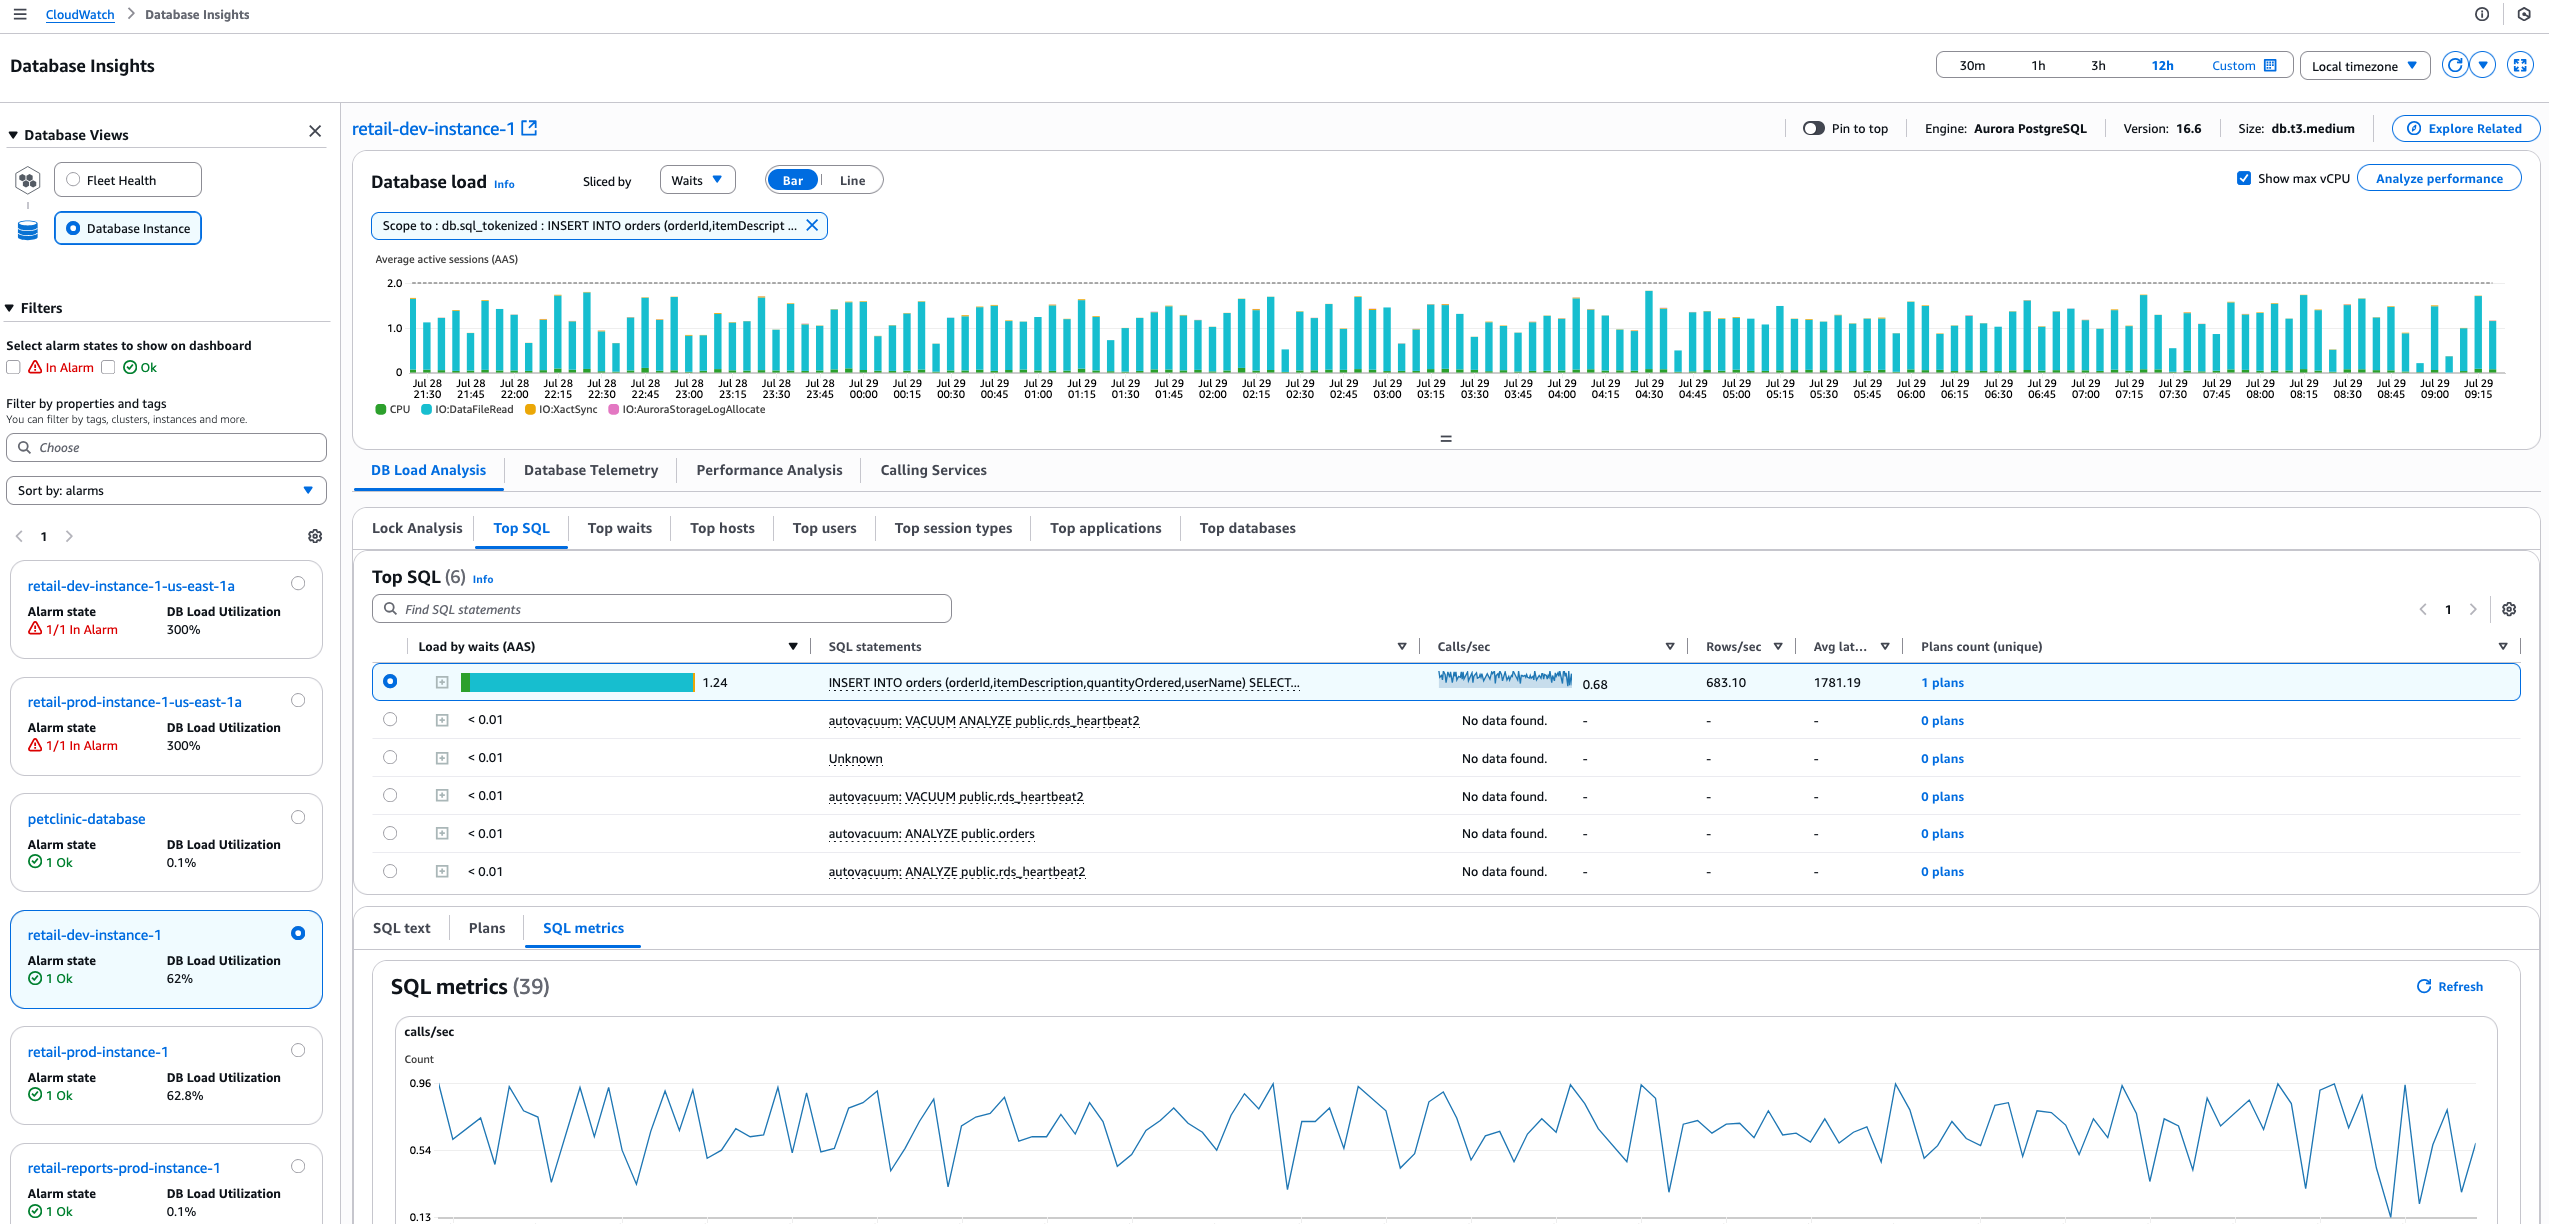
Use the Database Instance Dashboard to view a snapshot of the health of a DB instance.
To analyze lock trees and execution plans for Amazon Aurora PostgreSQL, see the following topics.
Topics
Database load chart
Database load (DB Load) measures the level of session activity in your database. DB Load is the key metric in Database Insights, and Database Insights collects DB Load every second.
For more information about DB Load, see Database load in the Amazon RDS User Guide or Database load in the Amazon Aurora User Guide.
Use the Database load chart to view DB Load sliced (grouped) by the following dimensions for all supported database engines.
-
Blocking object (only for database engines that support locking analysis)
-
Blocking session (only for database engines that support locking analysis)
-
Blocking SQL (only for database engines that support locking analysis)
-
Database
-
Host
-
SQL
-
User
-
Waits
-
Application (only for Amazon Aurora PostgreSQL)
-
Plans (only for database engines that support execution plan capture)
-
Session type (only for Amazon Aurora PostgreSQL)
Note
For information about analyzing Oracle PDB load in Amazon RDS, see Analyzing top Oracle PDB load in the Amazon RDS User Guide.
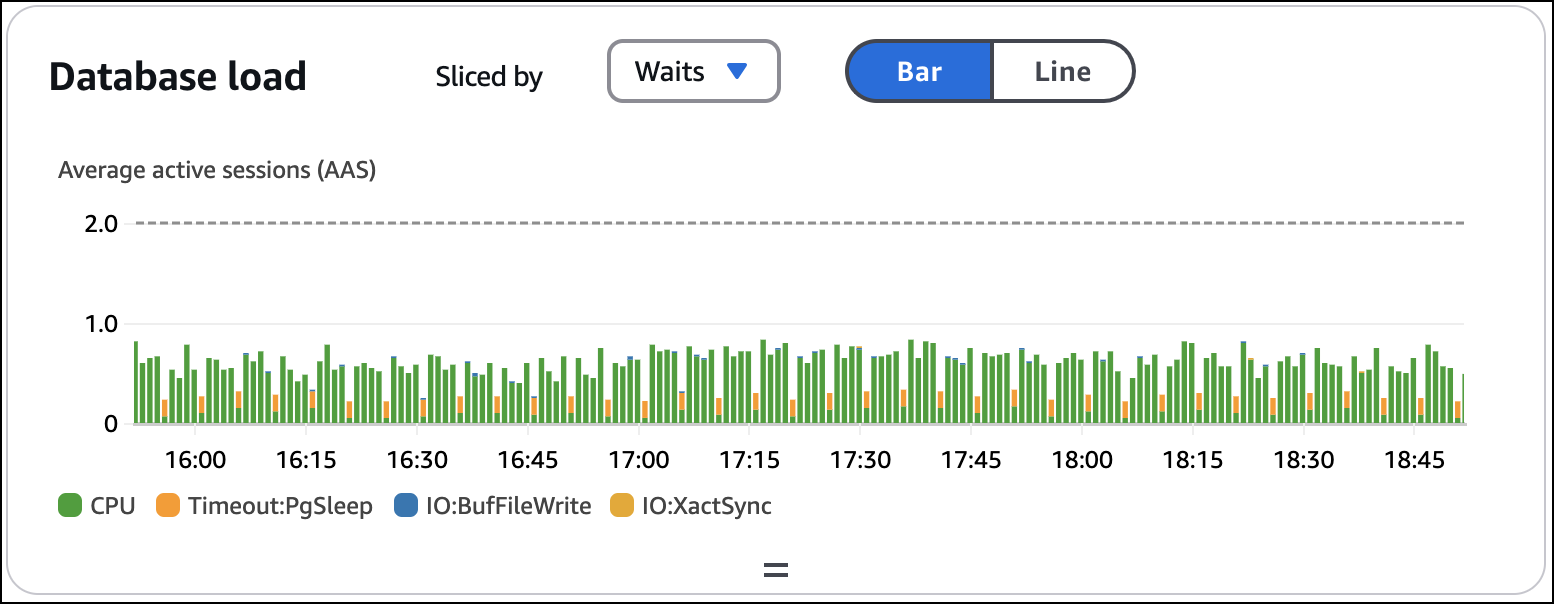
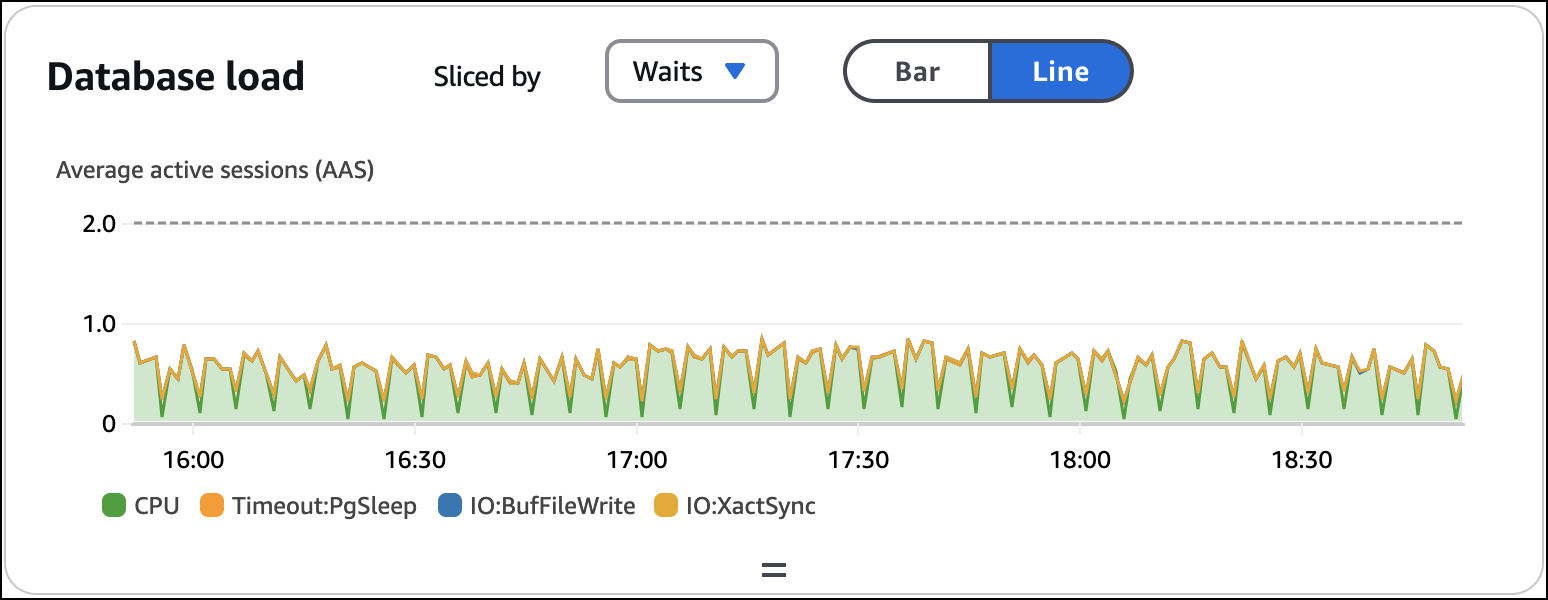
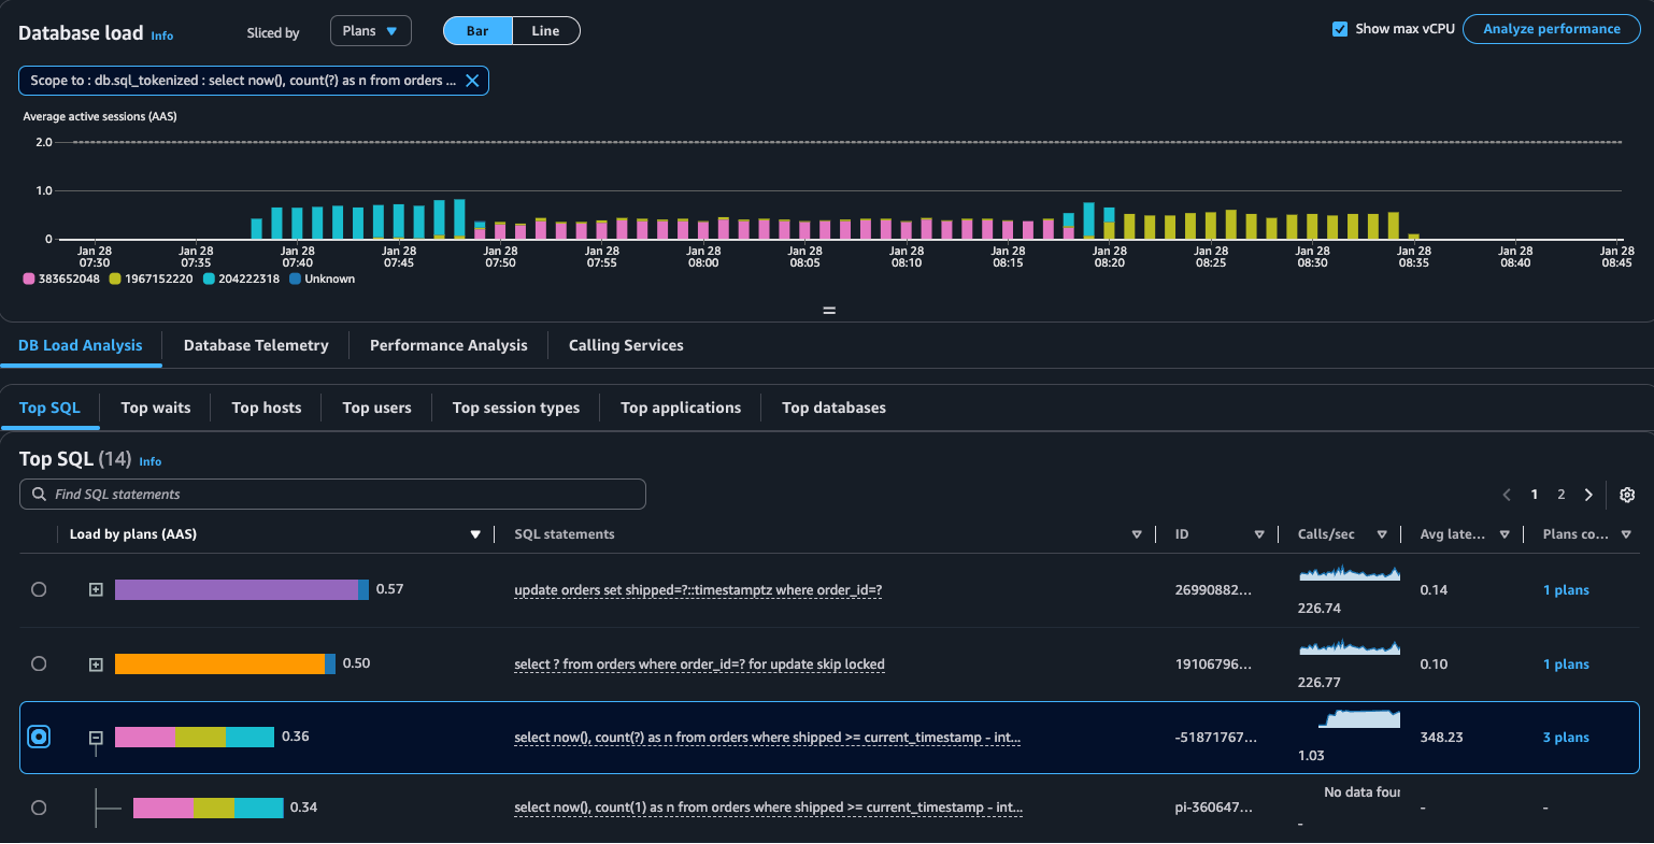
By default, CloudWatch displays DB Load with a bar chart. Choose Line to display DB Load with a stacked line chart.
DB Load analysis tab
Use the DB Load analysis tab to monitor the top contributors to DB Load for each of the following dimensions.
-
Database
-
Host
-
SQL
-
User
-
Waits
-
Lock analysis (only for database engines that support locking analysis)
-
Application (only for Amazon Aurora PostgreSQL)
-
Session type (only for Amazon Aurora PostgreSQL)
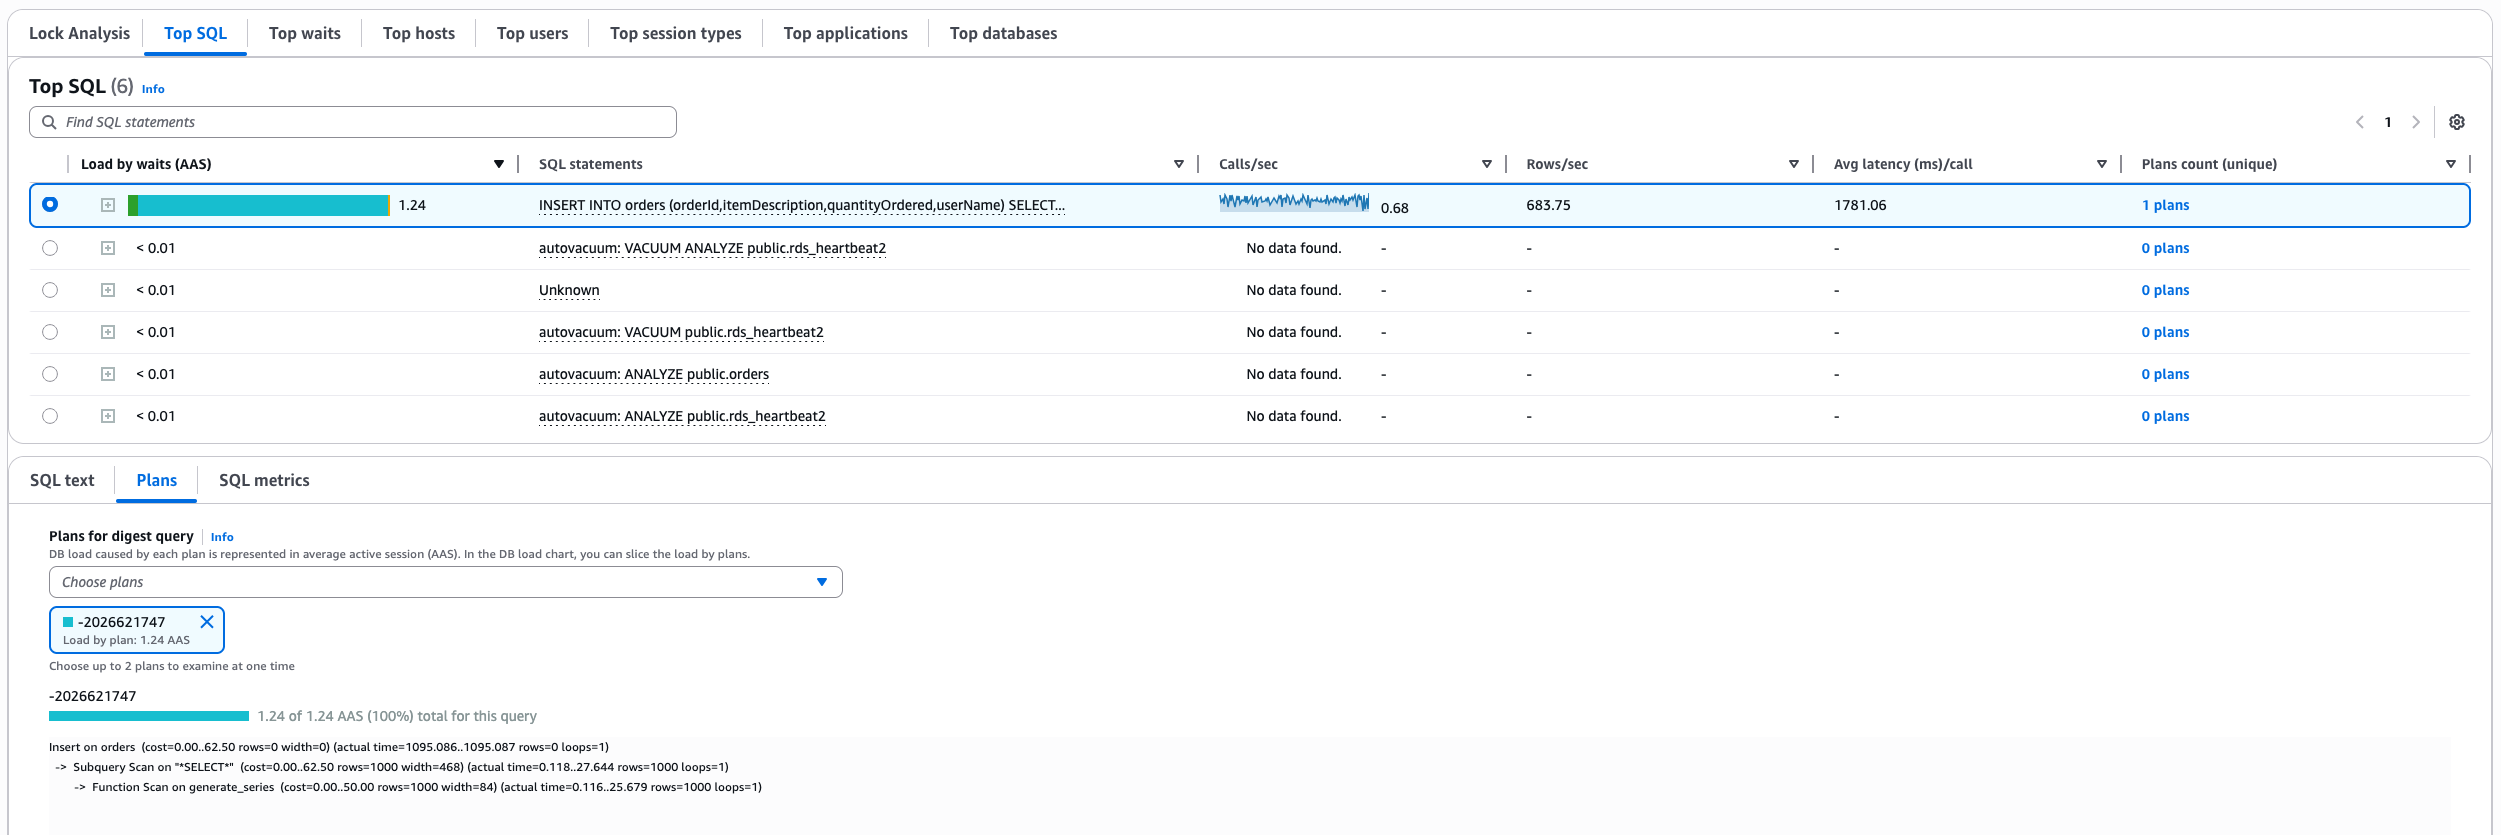
Analyze statistics for a query
You might want to analyze statistics for a query with a high DB Load. To analyze statistics for a query, use the following procedure.
To analyze statistics for queries
Sign in to the Amazon Web Services Management Console and open the CloudWatch console at https://console.amazonaws.cn/cloudwatch/
. -
Choose Insights.
-
Choose Database Insights.
-
Choose the Database Instance view.
-
Choose a DB instance.
-
Choose the Top SQL tab.
-
To view statistics for a query, choose a query.
Database telemetry tab
Use the Database telemetry tab to view metrics, logs, events, and slow queries for the selected instance.
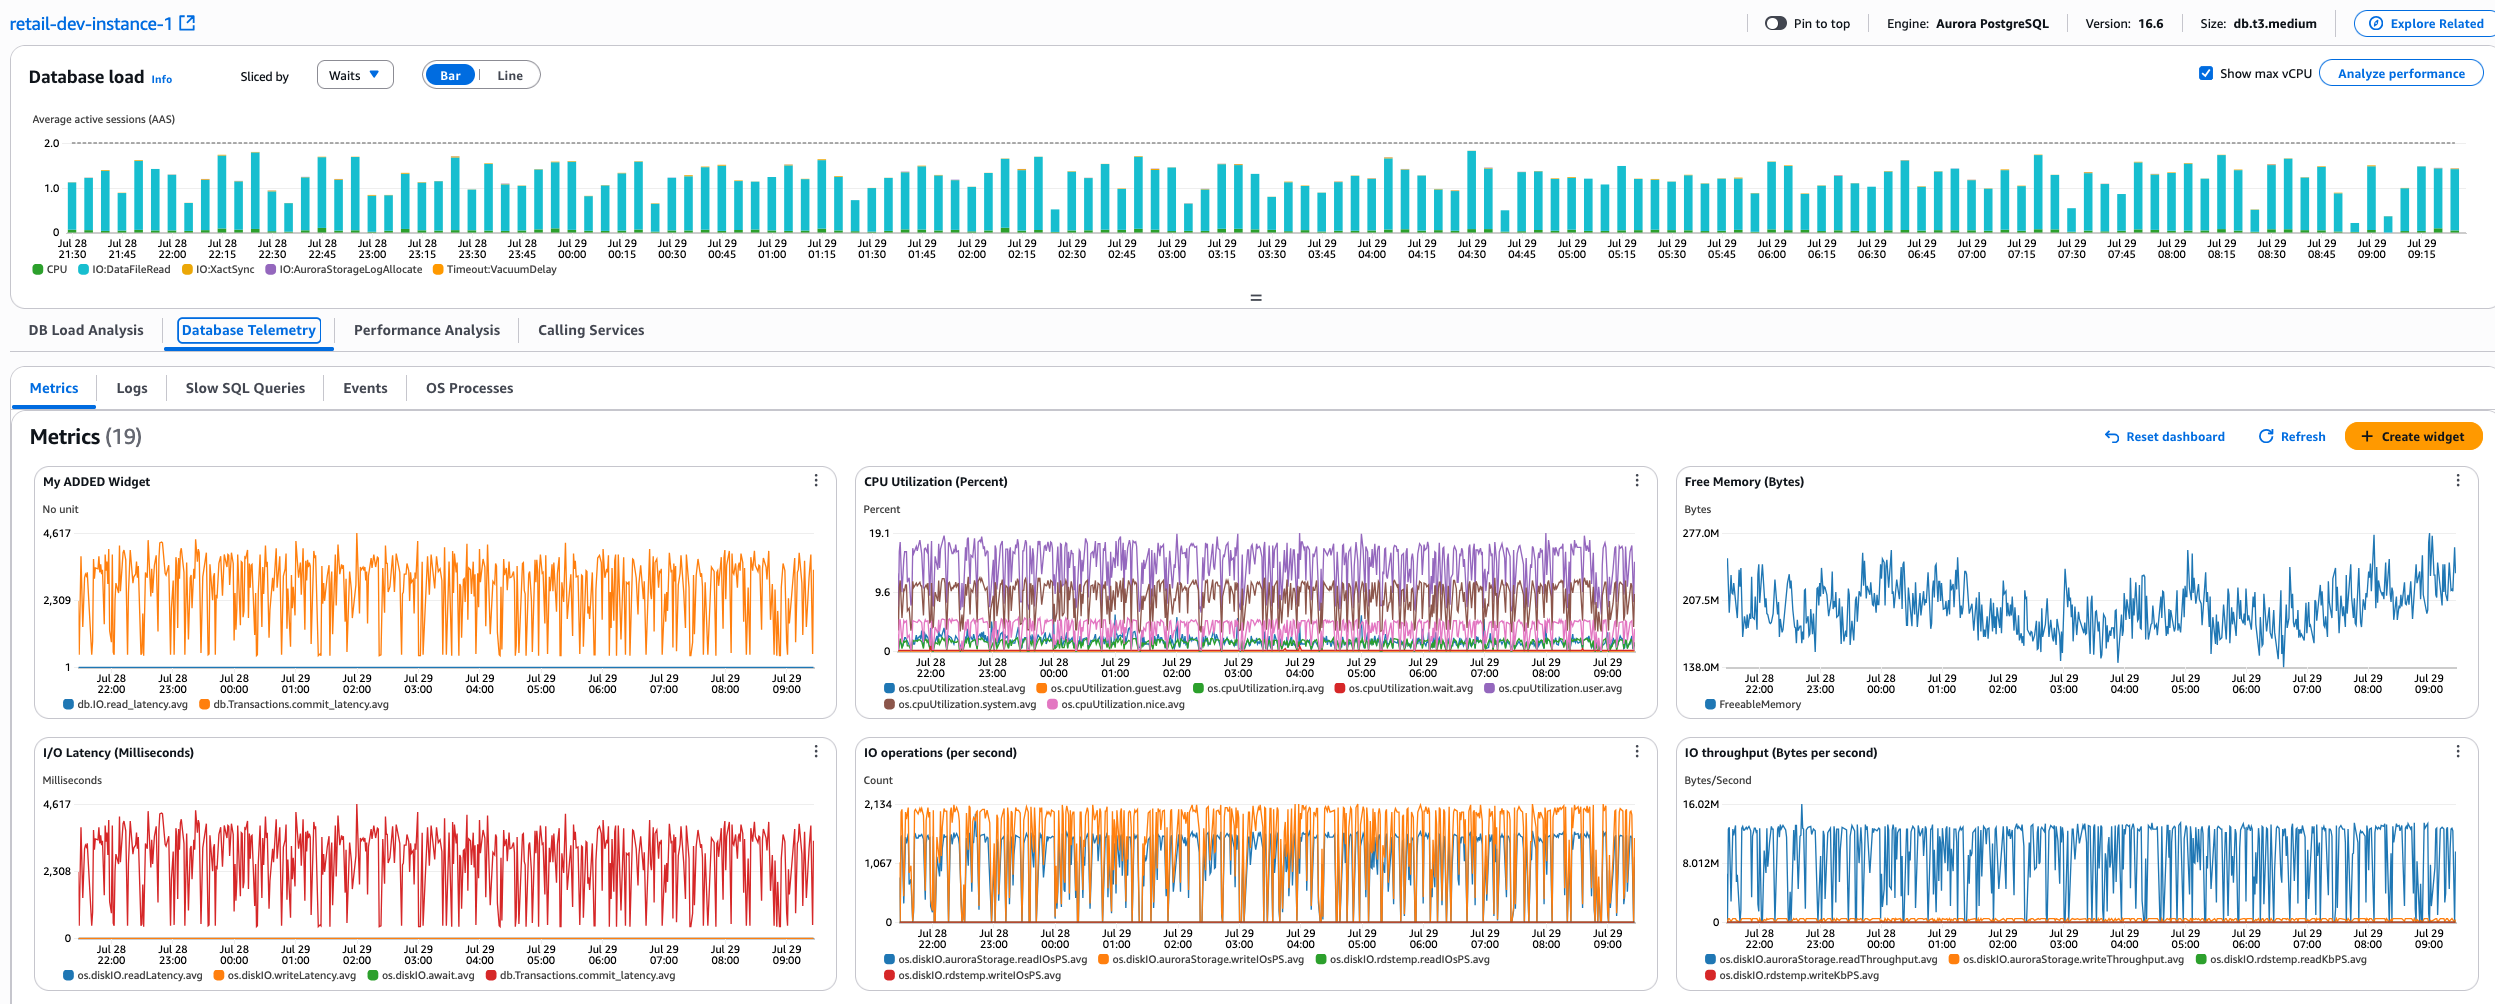
Metrics section for database telemetry
The Metrics section displays a default metrics dashboard customized for each engine type.
You can customize this dashboard by adding OS metrics, database counter metrics, and CloudWatch metrics to it. You can also remove metrics from the dashboard. You can customize one dashboard for each engine type in a Region in your account. This means that all instances for a specific engine type in that Region in the same account will have the same metrics dashboard.
Users who have edit permissions for your dashboards in your account can edit any dashboard for any engine.
Changes you make to a dashboard are saved automatically, and apply to every instance of the database engine in that Region and account.
To customize the dashboard in the Database telemetry tab for an engine type
Sign in to the Amazon Web Services Management Console and open the CloudWatch console at https://console.amazonaws.cn/cloudwatch/
. -
Choose Insights, Database Insights.
-
For Database Views, choose Database Instance.
-
In the Filters section, find and choose the database instance that you want to view metrics for.
-
Choose the Database Telemetry tab, then choose the Metrics tab.
The default database instance dashboard appears.
-
To add a widget to the dashboard, do the following:
-
Choose Add Create widget.
-
In the Create widget popup, find the metric or metrics that you want to add, and select the checkbox for each one. If you select multiple metrics in this step, they will all appear in the same new widget on the dashboard. Then choose Create widget.
Remember that any changes you make to this dashboard will apply to all Database Insights dashboards for this engine type in this Region in the account.
-
-
To delete a graph from the dashboard, choose the vertical ellipsis in the widget, then choose Delete.
-
To add more metrics to an existing widget in the dashboard, or change its title, choose the vertical ellipsis in the widget, and choose Edit. Then in the Update widget popup, find the metric or metrics that you want to add, select their checkboxes, and choose Update Widget. You can also change the widget title.
-
After customizing a dashboard, you can reset it to its original default state by choosing Reset Dashboard.
Logs section for database telemetry
The Logs section provides a view of database logs exported to CloudWatch Logs for the selected DB instance.
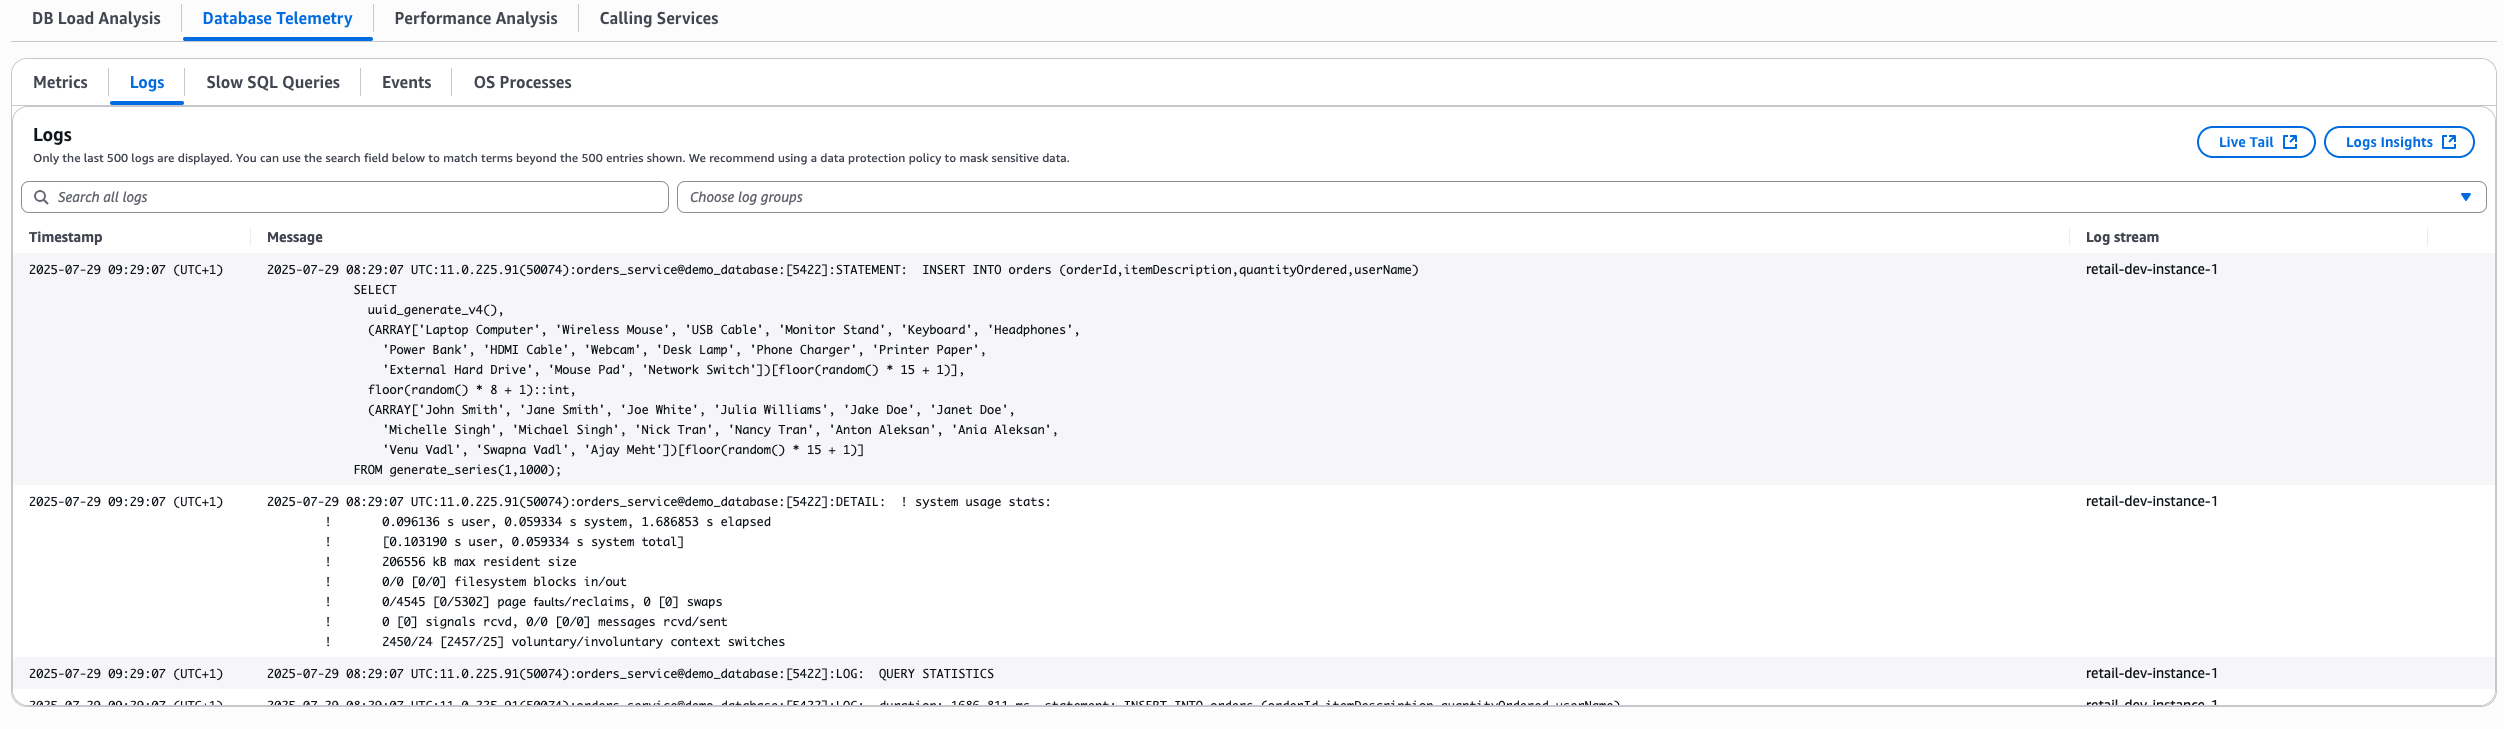
For information about publishing logs to CloudWatch Logs for Amazon RDS, see Publishing database logs to Amazon CloudWatch Logs in the Amazon RDS User Guide. For information about publishing logs to CloudWatch Logs for Amazon Aurora, see Publishing database logs to Amazon CloudWatch Logs in the Amazon Aurora User Guide.
For Aurora PostgreSQL Limitless Databases, logs are automatically published to CloudWatch Logs and are discoverable in the Database Insights console.
OS processes data for database telemetry
You can use the OS Processes tab within the Database telemetry tab to view metrics for the operating system (OS) that your DB instance runs on. The metrics provide a snapshot of OS processes running on your databases for a given timestamp, as well as key metrics such as memory and CPU utilization for each running process. Database Insights correlates these metrics with the metrics in your database load chart, so if you choose a data point in the database load chart, the OS processes data is updated to display telemetry from the same time stamp.
When you choose a data point, Database Insights automatically select the period to display,
depending on the time range you have chosen for the overall page. The farthest back
that you can go depends on the retention time that you have configured for the
RDSOSMetrics log group.
If you haven't chosen a time stamp, by default the table is populated with telemetry for the latest timestamp.
Note
OS process information is available only if you have Amazon RDS Enhanced Monitoring enabled. Enhanced Monitoring incurs additional charges. For more information, see Cost of Enhanced Monitoring. Enhanced Monitoring is automatically enabled for Aurora PostgreSQL Limitless Databases.
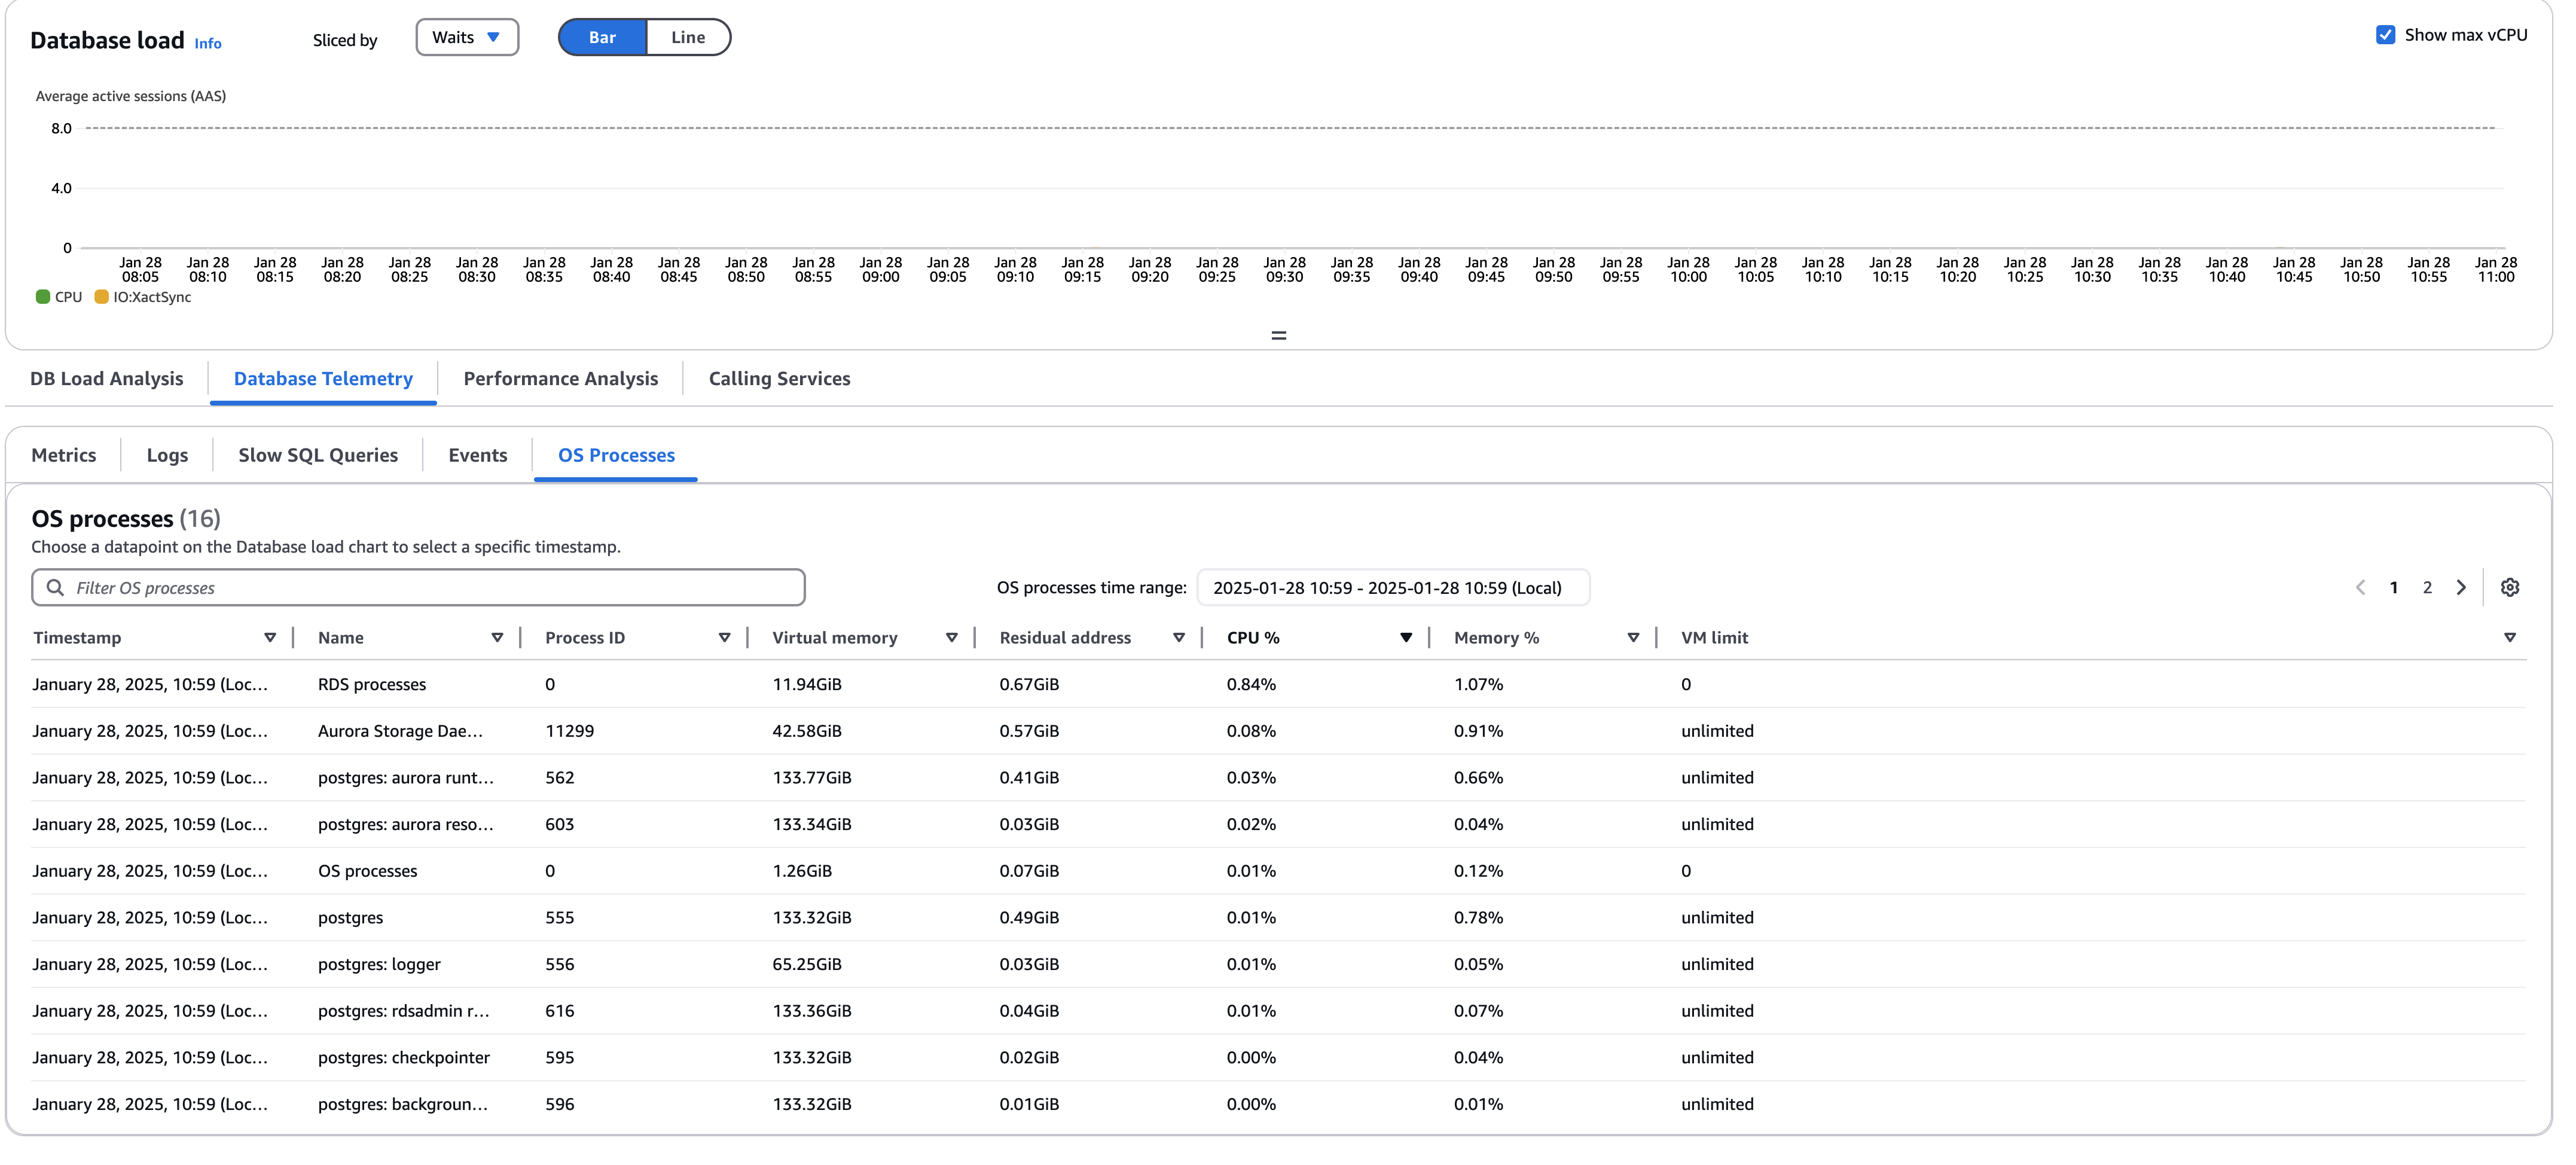
In the OS processes view, the following data is displayed for each process:
-
Process ID –The ID of this process.
-
Virtual memory –The amount of virtual memory allocated to the process, in Kibibytes.
-
Residual address – The actual physical memory being used by the process.
-
CPU % – The percentage of the total CPU bandwidth being used by the process.
-
Memory % – The percentage of the total memory being used by the process.
-
VM limit – The maximum amount of virtual memory that can be allocated to the process.
If the value in this column is 0, then VM limits are not applicable to that process.
The monitoring data that is displayed is retrieved from Amazon CloudWatch Logs. You can also retrieve these metrics directly from the log stream in CloudWatch Logs. For more information, see Viewing OS metrics using CloudWatch Logs.
OS processes metrics are not returned during the following:
-
A failover of the database instance.
-
Changing the instance class of the database instance (scale compute).
OS processes metrics are returned during a reboot of a database instance because only the database engine is rebooted. Metrics for the operating system are still reported.
Slow SQL Queries section for database telemetry
To view slow SQL queries and query patterns, you must enable log exports to CloudWatch Logs and configure DB parameters for your database.
For information about publishing Amazon RDS logs to CloudWatch Logs, see Publishing database logs to Amazon CloudWatch Logs in the Amazon RDS User Guide.
For information about publishing Aurora logs to CloudWatch Logs, see Publishing database logs to Amazon CloudWatch Logs in the Amazon Aurora User Guide.
For information about configuring DB parameters for your database in Amazon RDS, see Configuring your database to monitor slow SQL queries with Database Insights for Amazon RDS in the Amazon RDS User Guide.
For information about configuring DB parameters for your database in Amazon Aurora, see Configuring your database to monitor slow SQL queries with Database Insights for Amazon Aurora in the Amazon Aurora User Guide.
The Slow SQL Queries section provides a list of slow query patterns sorted by frequency. By selecting a pattern, you can view a list of slow queries that match the selected pattern. You can use the slow query list to identify slow queries affecting your DB instance.
Database Insights displays statistics for slow queries. The statistics represent only queries that exceed the configured slow query duration threshold.
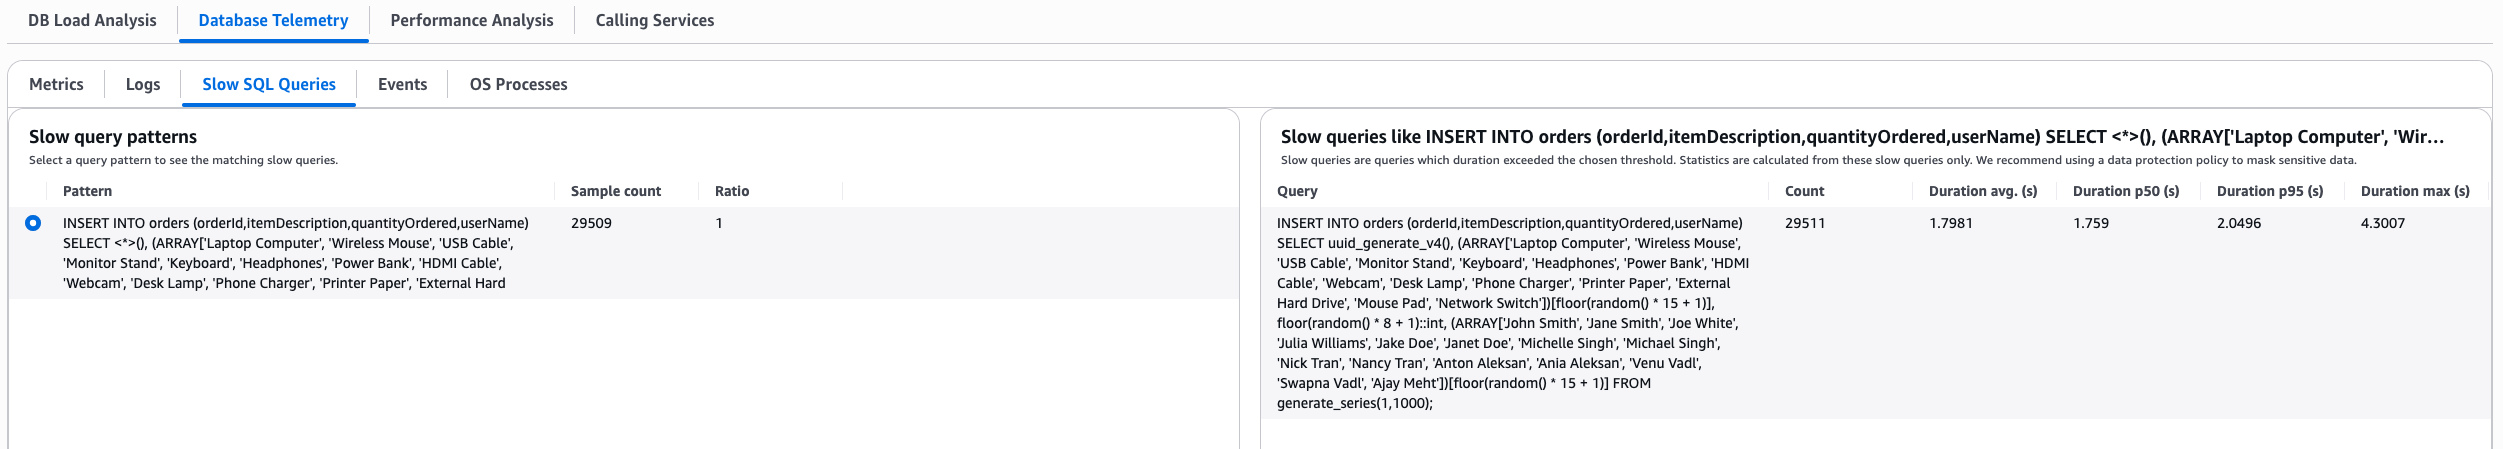
Important
Slow queries may contain sensitive data. Mask your sensitive data with CloudWatch Logs. For more information about masking log data, see Help protect sensitive log data with masking in the Amazon CloudWatch Logs User Guide.
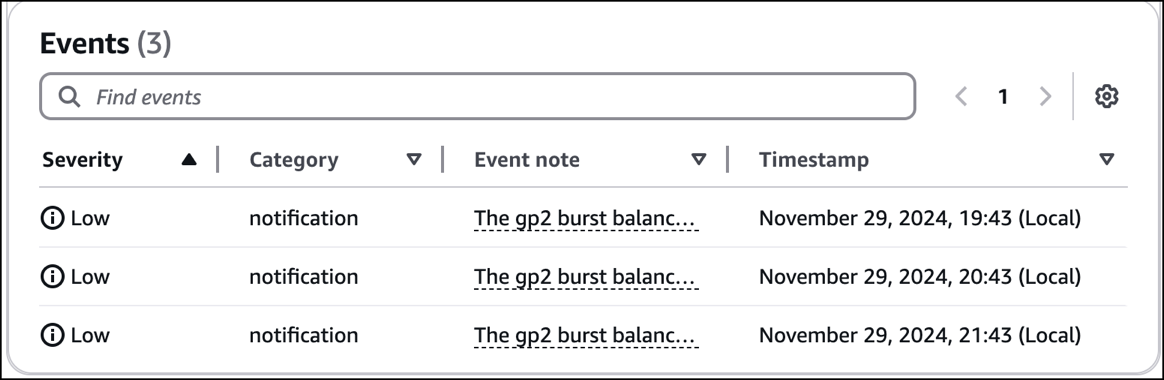
Events table
Use the Events table to view RDS events for your DB instance. For a list of events for Amazon Aurora, see Amazon RDS event categories and event messages for Aurora in the Amazon Aurora User Guide. For a list of events for Amazon Relational Database Service, see Amazon RDS event categories and event messages for Aurora in the Amazon RDS User Guide.
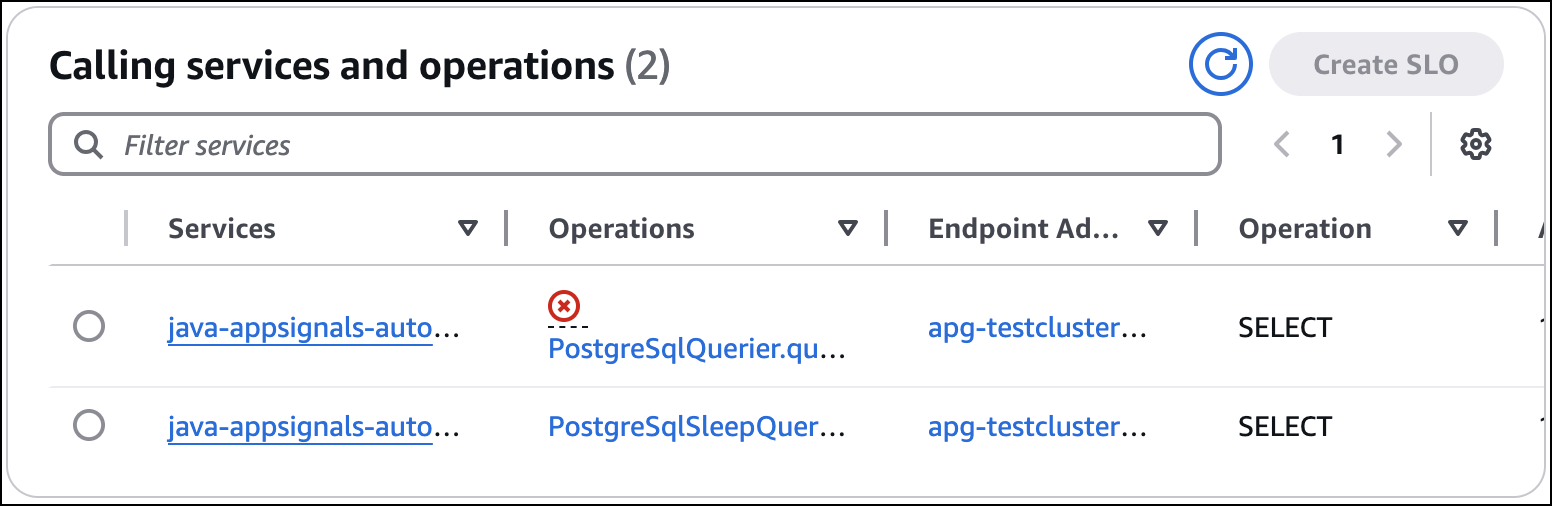
Calling services tab
Database Insights shows the services and operations that are calling your instance. Database Insights integrates with CloudWatch Application Signals to provide metrics for each service and operation, including availability, latency, errors, and volume.
When the endpoint called by the application is an Aurora cluster, Database Insights will show either the writer or the reader endpoint for the Aurora cluster in the Calling services table, not the individual database instance. However, when the endpoint called by the application is an Amazon RDS cluster, Database Insights shows the specific database instance the application is calling within the Amazon RDS cluster."
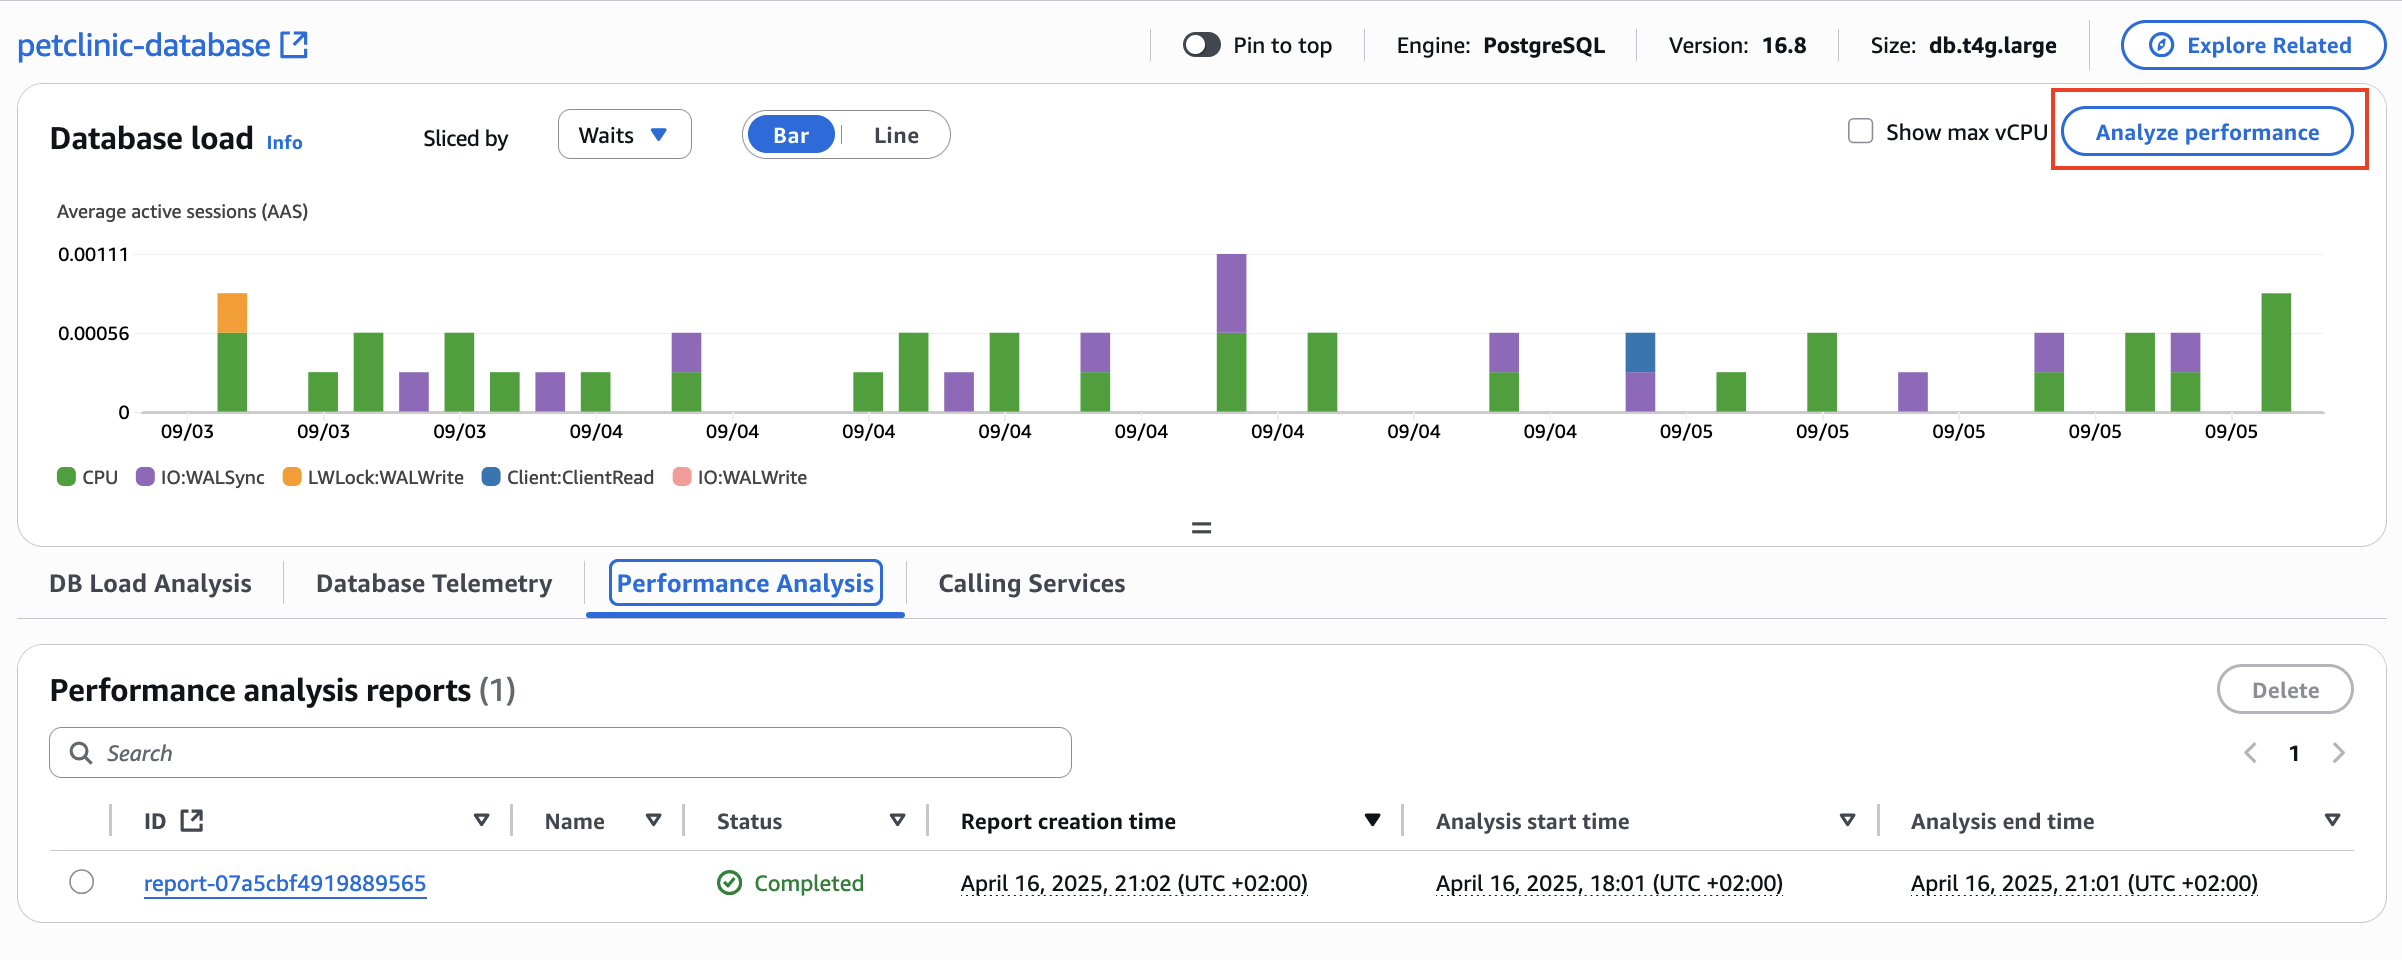
Analyze database performance on demand with CloudWatch Database Insights
Analyze database performance with on-demand analyses for your Amazon RDS databases with CloudWatch Database Insights.
You can run on-demand performance analysis by selecting Analyze Performance on the top right corner of the Database load chart. The report will run for the selected time period. Use the Performance analysis tab to view performance analysis reports for databases in your fleet.
For information about performance analysis reports for Amazon Aurora, see Analyzing database performance for a period of time in the Amazon Aurora User Guide.
Integrating CloudWatch Database Insights with CloudWatch Application Signals
Integrate CloudWatch Database Insights with CloudWatch Application Signals.
Use the Calling services tab to view the CloudWatch Application Signals services and operations that called an endpoint of the selected instance. By default, CloudWatch sorts the table by fault rate. Choose values in the Services, Operations, or Endpoint address columns to view the corresponding resource in the CloudWatch Application Signals console.
For more information about supported systems for CloudWatch Application Signals, see Supported systems.