Monitoring volume storage capacity
You can view a volume's available storage and it's storage distribution in Amazon Web Services Management Console, Amazon CLI, and the NetApp ONTAP CLI.
To monitor a volume's storage capacity (console)
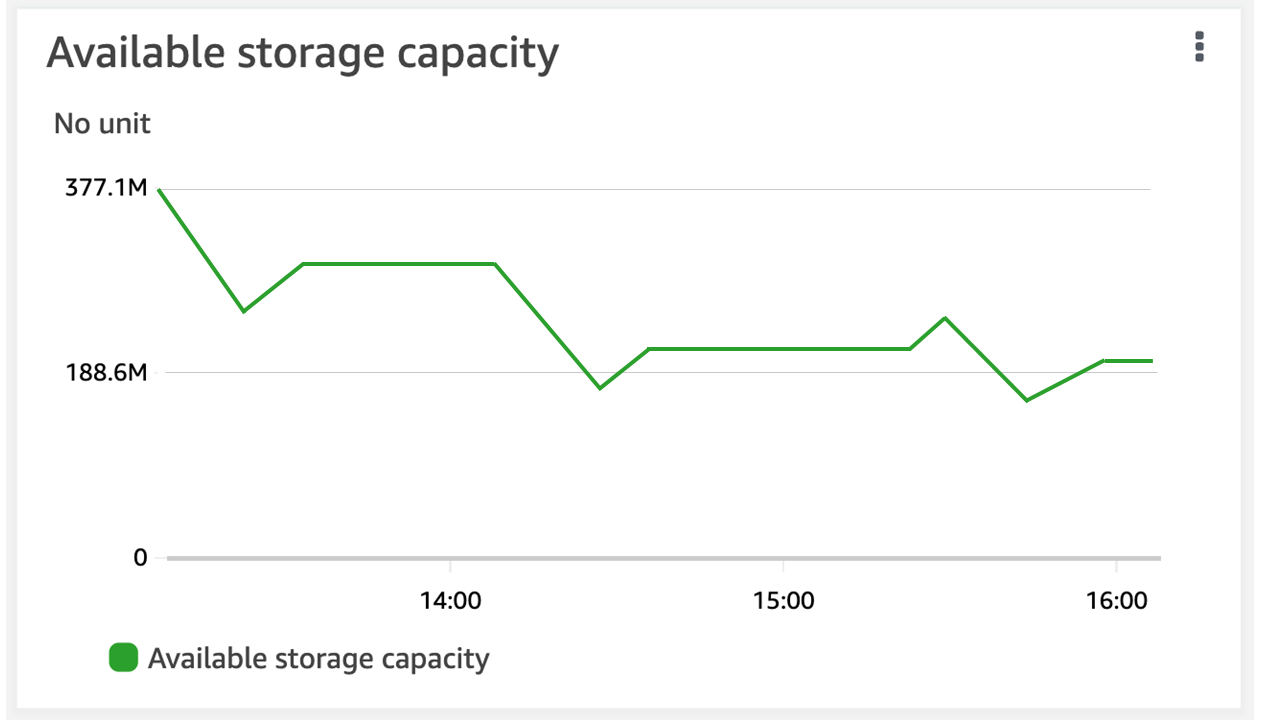
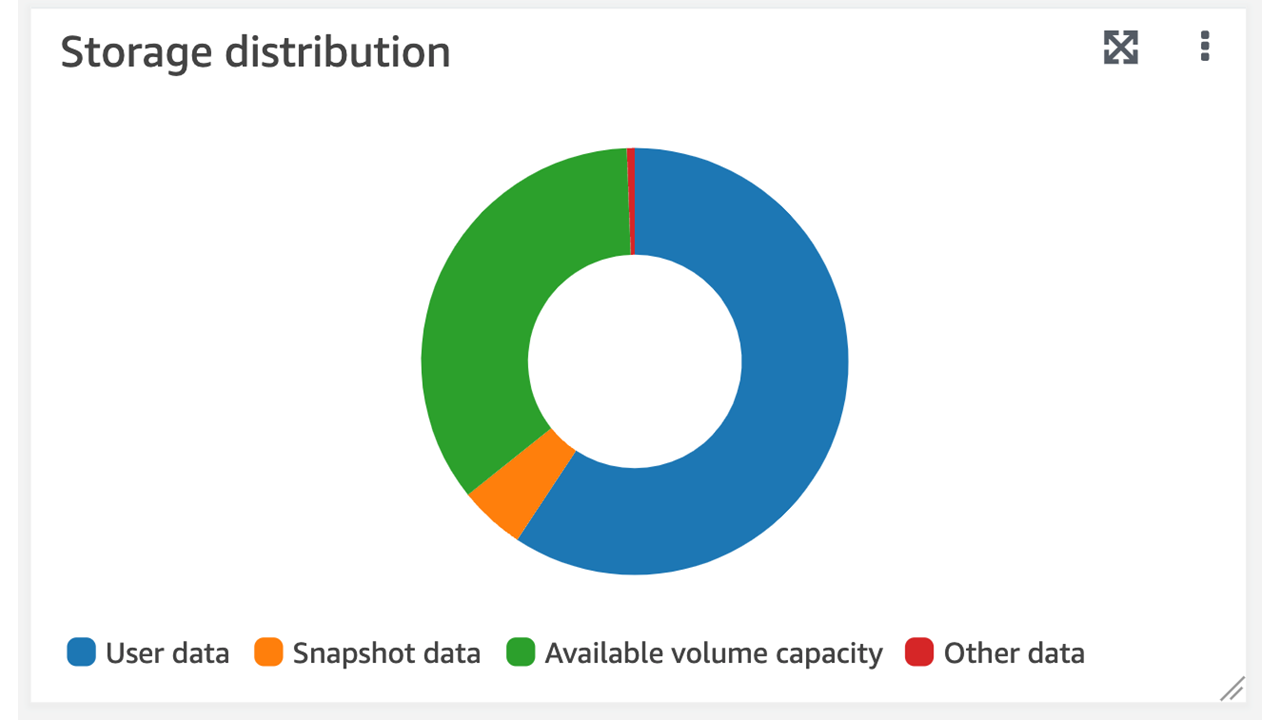
The Available storage graph displays the amount of free storage capacity on a volume over time. The Storage distribution graph shows how a volume's storage capacity is currently distributed over 4 categories:
User data
Snapshot data
Available volume capacity
Other data
Open the Amazon FSx console at https://console.amazonaws.cn/fsx/
. Choose Volumes in the left navigation column, then choose the ONTAP volume that you want to view storage capacity information for. The volume detail page appears.
In the second panel, choose the Monitoring tab. The Available storage and Storage distribution graphs display, along with several other graphs.
To monitor a volume's storage capacity (ONTAP CLI)
You can monitor how your volume's storage capacity is being consumed by using the volume show-space
ONTAP CLI command. For more information, see
volume show-space
To access the ONTAP CLI, establish an SSH session on the management port of the Amazon FSx for NetApp ONTAP file system or SVM by running the following command. Replace
management_endpoint_ip[~]$ssh fsxadmin@management_endpoint_ipFor more information, see Managing file systems with the ONTAP CLI.
View a volume's storage capacity usage by issuing the following command, replacing the following values:
-
Replace
svm_name -
Replace
vol_name
::>volume show-space -vserversvm_name-volumevol_nameIf the command is successful, you'll see output similar to the following:
Vserver :
svm_nameVolume :vol_nameFeature Used Used% -------------------------------- ---------- ------ User Data 140KB 0% Filesystem Metadata 164.4MB 1% Inodes 10.28MB 0% Snapshot Reserve 563.2MB 5% Deduplication 12KB 0% Snapshot Spill 9.31GB 85% Performance Metadata 668KB 0% Total Used 10.03GB 91% Total Physical Used 10.03GB 91%The output of this command shows the amount of physical space that different types of data occupy on this volume. It also shows the percentage of the total volume's capacity that each type of data consumes. In this example,
Snapshot SpillandSnapshot Reserveconsume a combined 90 percent of the volume's capacity.-
Snapshot Reserve shows the amount of disk space reserved for storing Snapshot copies. If the Snapshot copies storage exceeds the reserve space,
it spills into the file system and this amount is shown under Snapshot Spill.
To increase the amount of available space, you can either increase the size of the volume, or you can delete snapshots that you are not using, as shown in the following procedures.
For FlexVol volume types (the default volume type for FSx for ONTAP volumes), you can also enable volume autosizing. When you enable autosizing, the volume size automatically increases when it reaches certain thresholds. You can also disable automatic snapshots. Both of these features are explained in the following sections.