The SiteWise Monitor feature is not available to new customers. Existing customers can continue to use the service as normal. For more information, see SiteWise Monitor availability change
Add properties and alarms to dashboards
As the project owner, you define dashboards to give your viewers a standard way to look at asset properties and alarms. By providing a consistent view, you ensure that everyone sees the data that you want them to see, in the same manner. You group asset properties and alarms on to dashboards in a way that makes sense for your business and viewers.
Note
Project viewers can't modify a dashboard.
You can add asset properties to a new dashboard or an existing dashboard.
To add asset properties
In the navigation bar, choose the Projects icon.

-
Choose one of the following options:
-
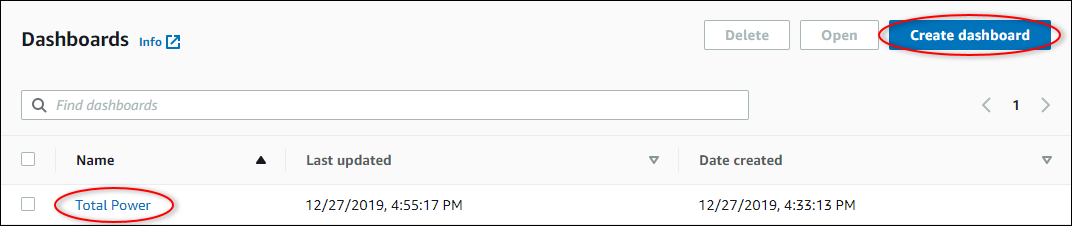
To add asset properties and alarms to an existing dashboard, choose the dashboard to update, and then choose Edit.
-
To add asset properties and alarms to a new dashboard, choose Create dashboard.
-
-
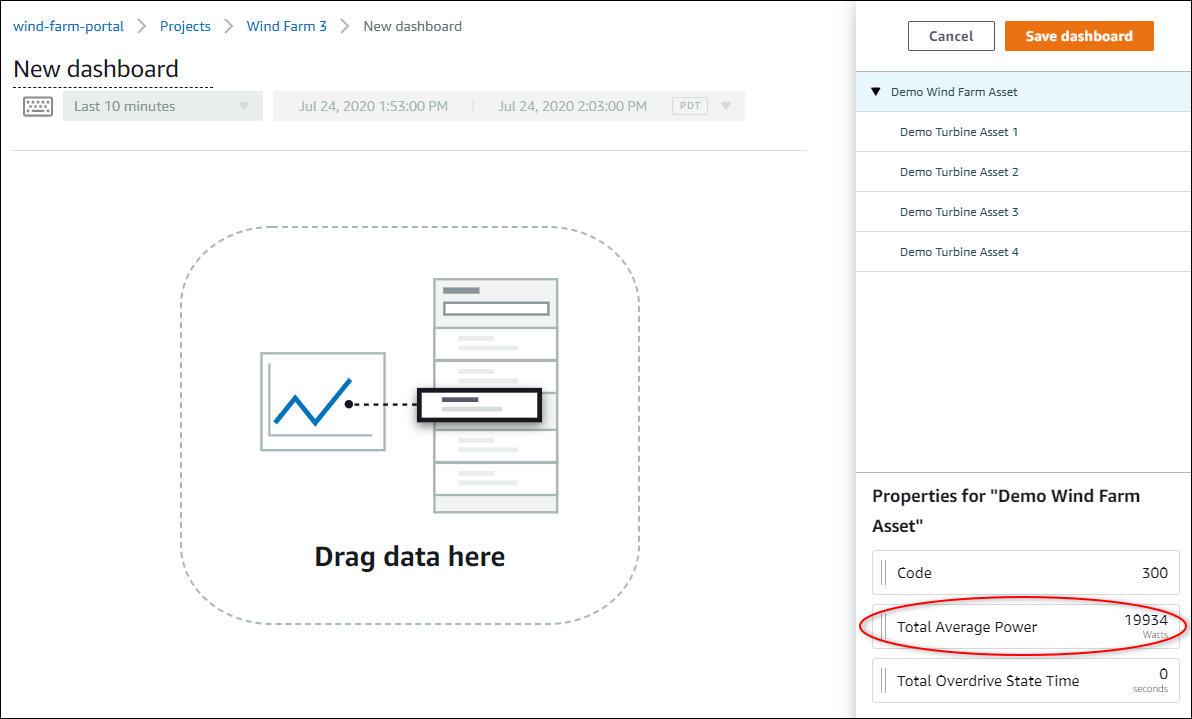
Choose the asset whose properties or alarms that you want to add to the dashboard.
-
Choose Properties to view the asset's properties or Alarms to view the asset's alarms. If an alarm monitors a property, you automatically add that alarm to the dashboard when you add its property.
-
Drag a property or alarm from the asset hierarchy to the dashboard. You can add multiple properties and alarms to one visualization.
The asset property appears on the dashboard with a default visualization type:
-
The default visualization type for non-string properties is the line chart.
-
The default visualization type for string properties is the KPI widget.
-
The default visualization type for alarms is the status grid widget.
You can change the visualization type and customize the visualization settings. For more information, see Customize visualizations.
-