The SiteWise Monitor feature is not available to new customers. Existing customers can continue to use the service as normal. For more information, see SiteWise Monitor availability change
View asset data in Amazon IoT SiteWise Monitor
On the Assets page, you can view all properties and alarms of any asset that is associated with the projects to which you have access. Portal administrators have access to all assets in the portal and can use the Assets page to explore individual assets before adding them to projects. Dashboards provide a common visualization for all project viewers.
The following procedures describe how to view asset data on the Assets page and how to view asset data from a project page. For information about viewing asset data in dashboards, see View dashboards in Amazon IoT SiteWise.
To view asset data on the Assets page
-
Log in to your Amazon IoT SiteWise Monitor portal. For more information, see Sign in to an Amazon IoT SiteWise Monitor portal.
In the navigation bar, choose the Assets icon.

-
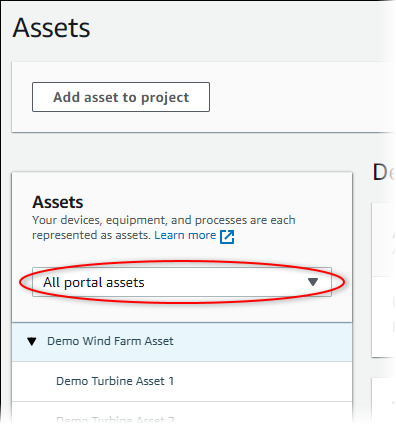
(Optional) Choose a project in the projects drop-down list to show only assets from a specific project.
-
Choose an asset in the Assets hierarchy.
Some assets might have a few static properties, called attributes. For example, a factory's properties, such as location, have only a single value and typically don't change over time.

-
Choose the arrow next to an asset to view all children of that asset, then choose an equipment asset. Amazon IoT SiteWise Monitor shows attributes, such as installation date, and time series data, such as availability or overall equipment effectiveness (OEE).

-
Do any of the following actions to adjust the displayed time range for your data:
-
Click and drag a time range on one of the line or bar charts to zoom in to the selected time range.
-
Double-click on a time range to zoom in on the selected point.
-
Press Shift and then double-click on a time range to zoom out from the selected point.
-
Press Shift and then drag the mouse on a time range to shift the range left or right.
-
Use the drop-down list to choose a predefined time range to view.
-
Use the time range control to open the calendar and specify a start and end time for your range.
-
-
Choose the Alarms tab to view the alarms for an asset.
-
Choose an alarm to view the alarm details and its state data as a time series.