Using X-Ray insights
Amazon X-Ray continuously analyzes trace data in your account to identify emergent issues in your applications. When fault rates exceed the expected range, it creates an insight that records the issue and tracks its impact until it's resolved. With insights, you can:
-
Identify where in your application issues are occurring, the root cause of the issue, and associated impact. The impact analysis provided by insights enables you to derive the severity and priority of an issue.
-
Receive notifications as the issue changes over time. Insights notifications can be integrated with your monitoring and alerting solution using Amazon EventBridge. This integration enables you to send automated emails or alerts based on the severity of the issue.
The X-Ray console identifies nodes with ongoing incidents in the trace map. To see a summary of the insight, choose the affected node. You can also view and filter insights by choosing Insights from the navigation pane on the left.
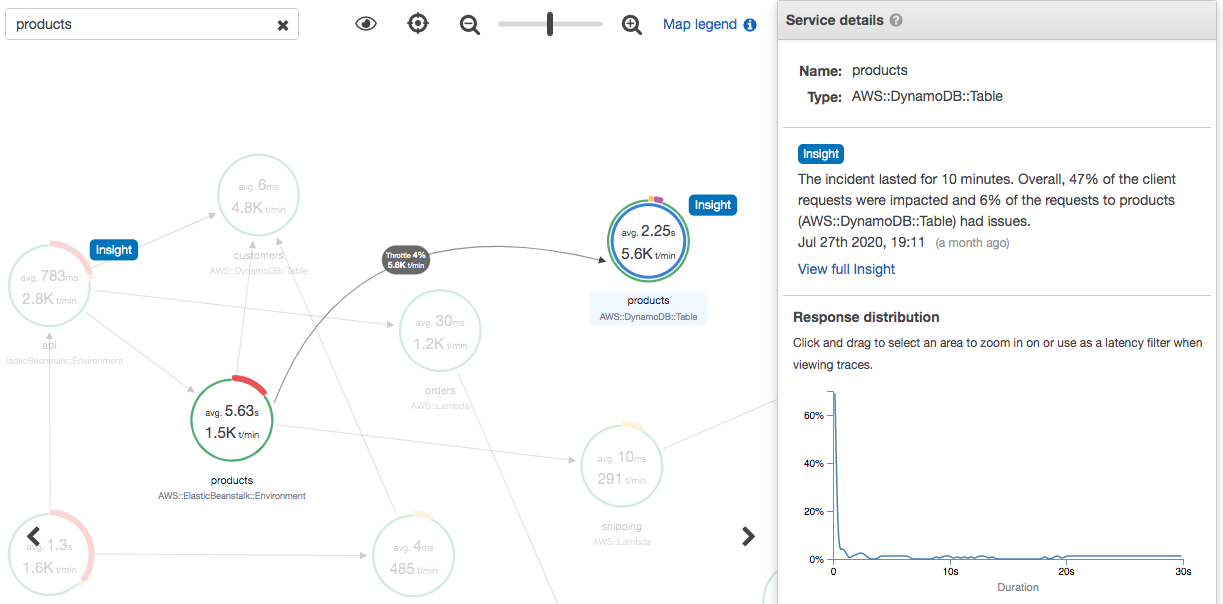
X-Ray creates an insight when it detects an anomaly in one or more nodes of the service map. The service uses statistical modeling to predict the expected fault rates of services in your application. In the preceding example, the anomaly is an increase in faults from Amazon Elastic Beanstalk. The Elastic Beanstalk server experienced multiple API call timeouts, causing an anomaly in the downstream nodes.
Enable insights in the X-Ray console
Insights must be enabled for each group you want to use insights features with. You can enable insights from the Groups page.
Open the X-Ray console
. -
Select an existing group or create a new one by choosing Create group, and then select Enable Insights. For more information about configuring groups in the X-Ray console, see Configuring groups.
-
In the navigation pane on the left, choose Insights, and then choose an insight to view.
Note
X-Ray uses GetInsightSummaries, GetInsight, GetInsightEvents, and GetInsightImpactGraph API operations to retrieve data from insights.
For more information, see How Amazon X-Ray works with IAM.
Enable insights notifications
With insights notifications, a notification is created for each insight event, such as when an insight is created, changes significantly, or is closed. Customers can receive these notifications through Amazon EventBridge events, and use conditional rules to take actions such as SNS notification, Lambda invocation, posting messages to an SQS queue, or any of the targets EventBridge supports. Insights notifications are emitted on a best-effort basis but are not guaranteed. For more information about targets, see Amazon EventBridge Targets.
You can enable insights notifications for any insights enabled group from the Groups page.
To enable notifications for an X-Ray group
Open the X-Ray console
. -
Select an existing group or create a new one by choosing Create group, ensure that Enable Insights is selected, and then select Enable Notifications. For more information about configuring groups in the X-Ray console, see Configuring groups.
To configure Amazon EventBridge conditional rules
-
Open the Amazon EventBridge console
. -
Navigate to Rules in the left navigation bar, and choose Create rule.
-
Provide a name and description for the rule.
-
Choose Event pattern, and then choose Custom pattern. Provide a pattern containing
"source": [ "aws.xray" ]and"detail-type": [ "AWS X-Ray Insight Update" ]. The following are some examples of possible patterns.-
Event pattern to match all incoming events from X-Ray insights:
{ "source": [ "aws.xray" ], "detail-type": [ "AWS X-Ray Insight Update" ] } -
Event pattern to match a specified
stateandcategory:{ "source": [ "aws.xray" ], "detail-type": [ "AWS X-Ray Insight Update" ], "detail": { "State": ["ACTIVE"], "Category": ["FAULT"] } }
-
-
Select and configure the targets that you would like to invoke when an event matches this rule.
-
(Optional) Provide tags to more easily identify and select this rule.
-
Choose Create.
Note
X-Ray insights notifications sends events to Amazon EventBridge, which does not currently support customer managed keys. For more information, see Data protection in Amazon X-Ray.
Insight overview
The overview page for an insight attempts to answer three key questions:
-
What is the underlying issue?
-
What is the root cause?
-
What is the impact?
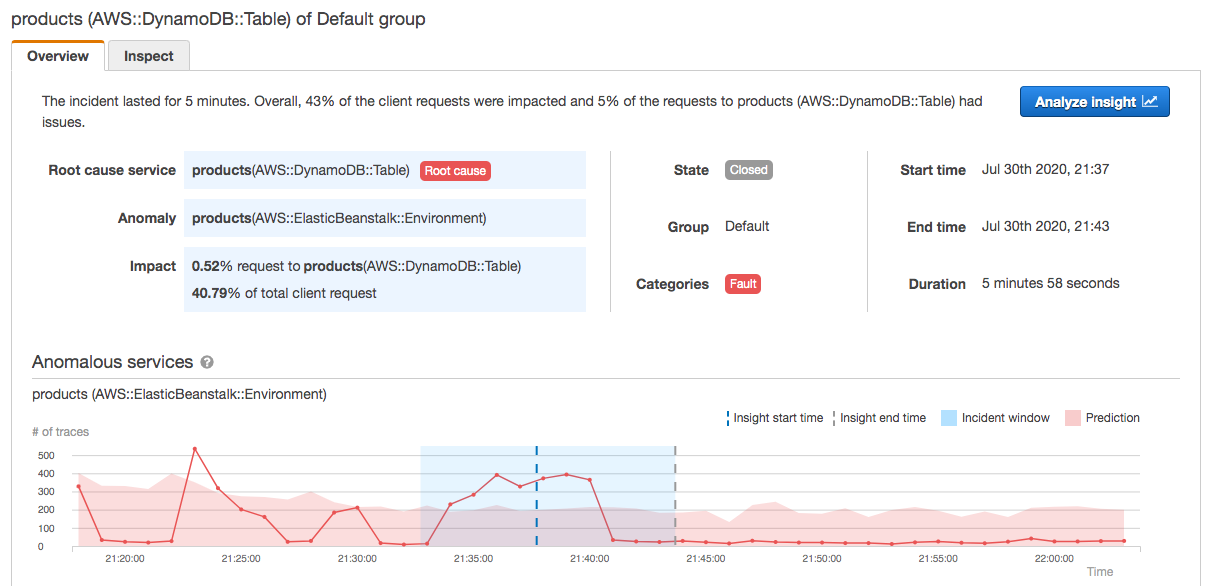
The Anomalous services section shows a timeline for each service that illustrates the change in fault rates during the incident. The timeline shows the number of traces with faults overlaid on a solid band that indicates the expected number of faults based on the amount of traffic recorded. The duration of the insight is visualized by the Incident window. The incident window begins when X-Ray observes the metric becoming anomalous and persists while the insight is active.
The following example shows an increase in faults that caused an incident:
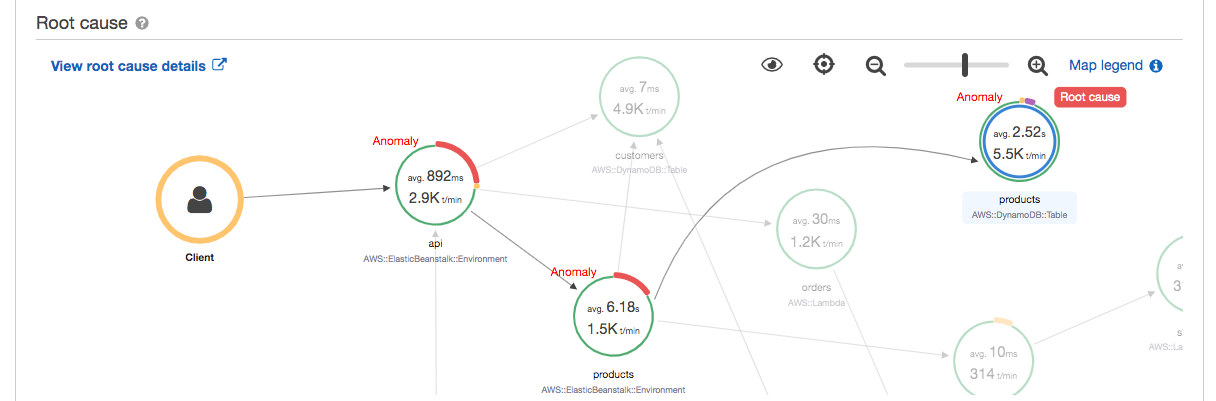
The Root cause section shows a trace map focused on the root cause service and the impacted path. You may hide the unaffected nodes by selecting the eye icon in the top right of the Root cause map. The root cause service is the farthest downstream node where X-Ray identified an anomaly. It can represent a service that you instrumented or an external service that your service called with an instrumented client. For example, if you call Amazon DynamoDB with an instrumented Amazon SDK client, an increase in faults from DynamoDB results in an insight with DynamoDB as the root cause.
To further investigate the root cause, select View root cause details on the root cause graph. You can use the Analytics page to investigate the root cause and related messages. For more information, see Interacting with the Analytics console.
Faults that continue upstream in the map can impact multiple nodes and cause multiple anomalies. If a fault is passed all the way back to the user that made the request, the result is a client fault. This is a fault in the root node of the trace map. The Impact graph provides a timeline of the client experience for the entire group. This experience is calculated based on percentages of the following states: Fault, Error, Throttle, and Okay.
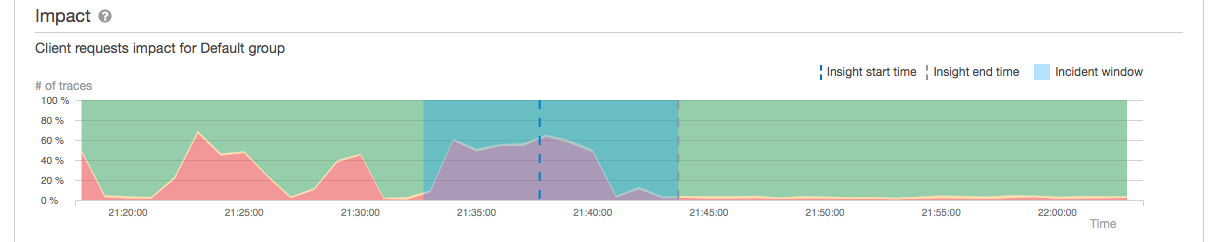
This example shows an increase in traces with a fault at the root node during the time of an incident. Incidents in downstream services don't always correspond to an increase in client errors.
Choosing Analyze insight opens the X-Ray Analytics console in a window where you can dive deep into the set of traces causing the insight. For more information, see Interacting with the Analytics console.
Understanding impact
Amazon X-Ray measures the impact caused by an ongoing issue as part of generating insights and notifications. The impact is measured in two ways:
-
Impact to the X-Ray group
-
Impact on the root cause service
This impact is determined by the percentage of request that are failing or causing an error within a given time period. This impact analysis allows you to derive the severity and priority of the issue based on your particular scenario. This impact is available as part of the console experience in addition to insights notifications.
Deduplication
Amazon X-Ray insights de-duplicates issues across multiple microservices. It uses anomaly detection to determine the service that is the root cause of an issue, determines if other related services are exhibiting anomalous behavior due to the same root cause, and records the result as a single insight.
Review an insight's progress
X-Ray reevaluates insights periodically until they are resolved, and records each notable intermediate change as a notification, which can be sent as an Amazon EventBridge event. This enables you to build processes and workflows to determine how the issue has changed over time, and take appropriate actions such as sending an email or integrating with an alerting system using EventBridge.
You can review incident events in the Impact Timeline on the Inspect page. By default the timeline displays the most impacted service until you choose a different service.
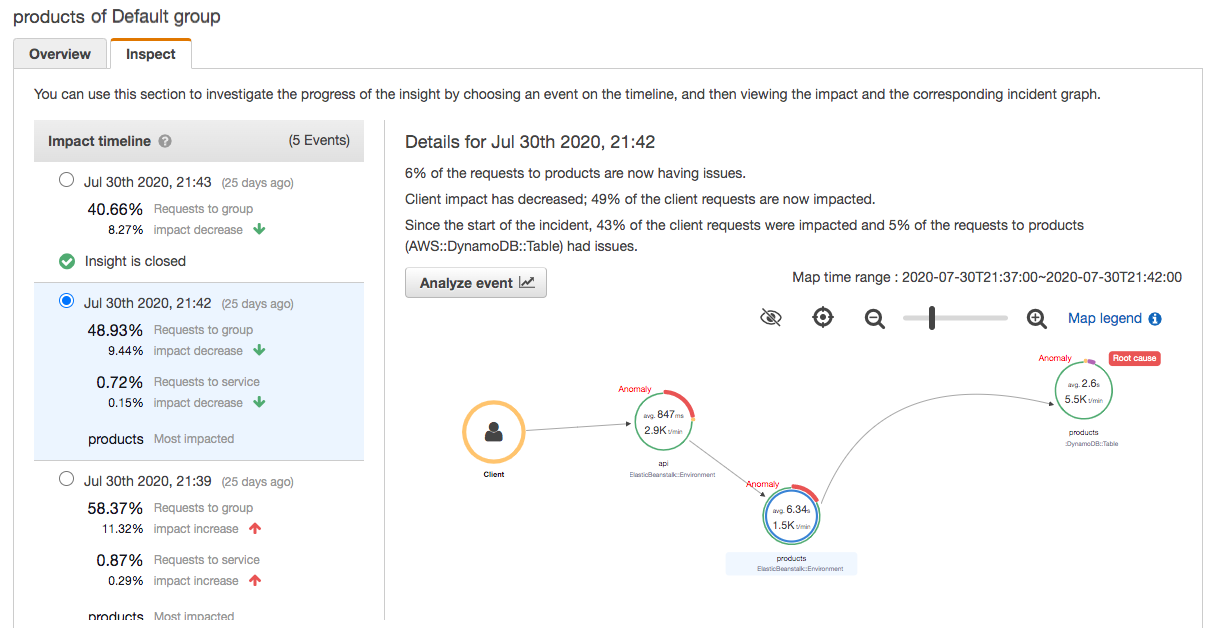
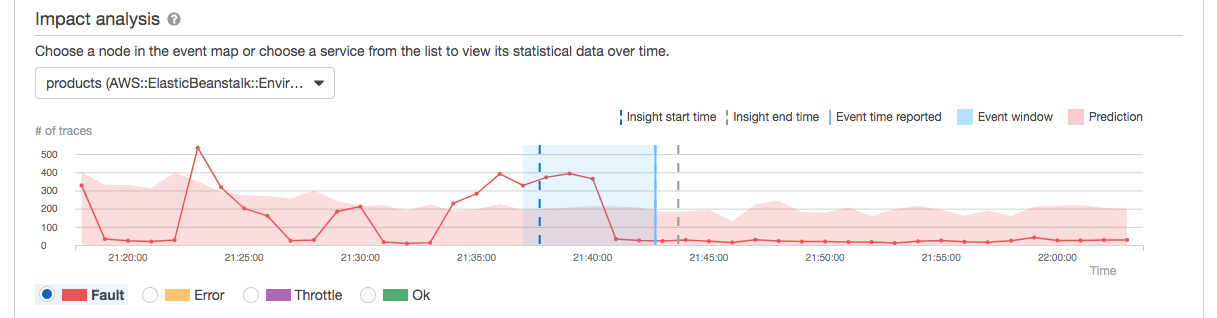
To see a trace map and graphs for an event, choose it from the impact timeline. The trace map shows services in your application that are affected by the incident. Under Impact analysis, graphs show fault timelines for the selected node and for clients in the group.
To take a deeper look at the traces involved in an incident, choose Analyze event on the Inspect page. You can use the Analytics page to refine the list of traces and identify affected users. For more information, see Interacting with the Analytics console.