Getting started with X-Ray
Note
X-Ray SDK/Daemon Maintenance Notice – On February 25th, 2026, the Amazon X-Ray SDKs/Daemon will enter maintenance mode, where Amazon will limit X-Ray SDK and Daemon releases to address security issues only. For more information on the support timeline, see X-Ray SDK and Daemon Support timeline. We recommend to migrate to OpenTelemetry. For more information on migrating to OpenTelemetry, see Migrating from X-Ray instrumentation to OpenTelemetry instrumentation .
To use X-Ray, take the following steps:
-
Instrument your application, which allows X-Ray to track how your application processes a request.
-
Use the X-Ray SDKs, X-Ray APIs, ADOT or CloudWatch Application Signals to send trace data to X-Ray. For more information about which interface to use, see Choosing an interface.
For more information about instrumentation, see Instrumenting your application for Amazon X-Ray.
-
-
(Optional) Configure X-Ray to work with other Amazon Web Services services that integrate with X-Ray. You can sample traces and add headers to incoming requests, run an agent or collector, and automatically send trace data to X-Ray. For more information, see Integrating Amazon X-Ray with other Amazon Web Services services.
-
Deploy your instrumented application. As your application receives requests, the X-Ray SDK will record trace, segment and subsegment data. In this step, you might also have to set up an IAM policy and deploy an agent or collector.
-
For example scripts to deploy an application using the Amazon Distro for OpenTelemetry (ADOT) SDK and the CloudWatch agent on different platforms, see Application Signals Demo Scripts
. -
For an example script to deploy an application using the X-Ray SDK and the X-Ray daemon, see Amazon X-Ray sample application.
-
-
(Optional) Open a console to view and analyze the data. You can see a GUI representation of a trace map, service map, and more to inspect how your application functions. Use the graphical information in the console to optimize, debug and understand your application. For more information about choosing a console, see Use a console.
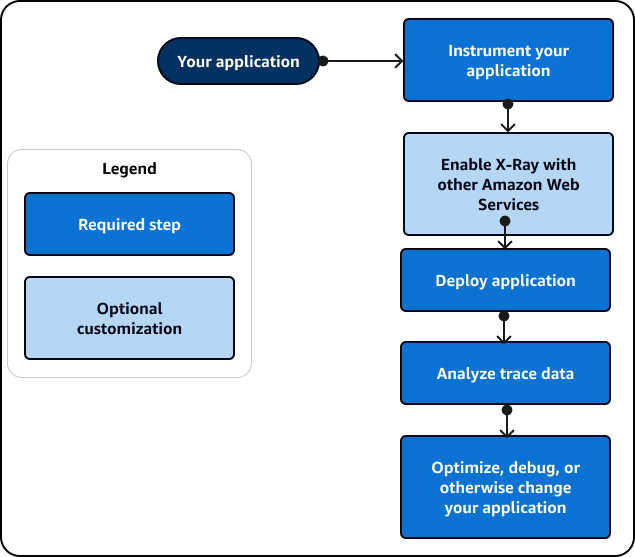
The following diagram shows how to get started using X-Ray:
For an example of the data and maps that are available in the console, launch a sample application that is already instrumented to generate trace data. In a few minutes, you can generate traffic, send segments to X-Ray, and view a trace and service map.