Services or capabilities described in Amazon Web Services documentation might vary by Region. To see the differences applicable to the China Regions,
see Getting Started with Amazon Web Services in China
(PDF).
Migrating to OpenTelemetry Java
This section provides guidance on migrating from the X-Ray SDK to the OpenTelemetry SDK for Java applications.
Zero code automatic instrumentation solution
- With X-Ray Java agent
-
To enable the X-Ray Java agent, your application's JVM arguments were required to be modified.
-javaagent:/path-to-disco/disco-java-agent.jar=pluginPath=/path-to-disco/disco-plugins
- With OpenTelemetry-based Java agent
-
To use OpenTelemetry-based Java agents.
-
Use the Amazon Distro for OpenTelemetry (ADOT) Auto-Instrumentation Java agent for automatic instrumentation with the ADOT Java agent. For more information,
see Auto-Instrumentation for Traces and Metrics with the Java agent. If you only want tracing, disable the OTEL_METRICS_EXPORTER=none environment variable. to export metrics from the Java
agent.
(Optional) You can also enable CloudWatch Application Signals when automatically instrumenting your applications on Amazon with the ADOT Java auto-instrumentation to monitor current application health and track
long-term application performance. Application Signals provides an unified, application-centric view of your applications, services, and dependencies, and helps monitor and triage application health. For more information, see Application Signals.
-
Use the OpenTelemetry Java agent for automatic instrumentation. For more information, see Zero-code instrumentation with the Java Agent.
Manual instrumentation solutions with the SDK
- Tracing setup with X-Ray SDK
-
To instrument your code with the X-Ray SDK for Java, first, the AWSXRay class was required to be configured with service plug-ins and local sampling rules, then a provided recorder was used.
static {
    AmazonXRayRecorderBuilder builder = AmazonXRayRecorderBuilder.standard().withPlugin(new EC2Plugin()).withPlugin(new ECSPlugin());
    AmazonXRay.setGlobalRecorder(builder.build());
}
- Tracing setup with OpenTelemetry SDK
-
The following dependencies are required.
<dependencyManagement>
        <dependencies>
            <dependency>
                <groupId>io.opentelemetry</groupId>
                <artifactId>opentelemetry-bom</artifactId>
                <version>1.49.0</version>
                <type>pom</type>
                <scope>import</scope>
            </dependency>
            <dependency>
                <groupId>io.opentelemetry.instrumentation</groupId>
                <artifactId>opentelemetry-instrumentation-bom</artifactId>
                <version>2.15.0</version>
                <type>pom</type>
                <scope>import</scope>
            </dependency>
        </dependencies>
    </dependencyManagement>
    <dependencies>
        <dependency>
            <groupId>io.opentelemetry</groupId>
            <artifactId>opentelemetry-sdk</artifactId>
        </dependency>
        <dependency>
            <groupId>io.opentelemetry</groupId>
            <artifactId>opentelemetry-api</artifactId>
        </dependency>
        <dependency>
            <groupId>io.opentelemetry.semconv</groupId>
            <artifactId>opentelemetry-semconv</artifactId>
        </dependency>
        <dependency>
            <groupId>io.opentelemetry</groupId>
            <artifactId>opentelemetry-exporter-otlp</artifactId>
        </dependency>
        <dependency>
            <groupId>io.opentelemetry.contrib</groupId>
            <artifactId>opentelemetry-aws-xray</artifactId>
            <version>1.46.0</version>
        </dependency>
        <dependency>
            <groupId>io.opentelemetry.contrib</groupId>
            <artifactId>opentelemetry-aws-xray-propagator</artifactId>
            <version>1.46.0-alpha</version>
        </dependency>
        <dependency>
            <groupId>io.opentelemetry.contrib</groupId>
            <artifactId>opentelemetry-aws-resources</artifactId>
            <version>1.46.0-alpha</version>
        </dependency>
    </dependencies>
Configure the OpenTelemetry SDK by instantiating a TracerProvider and globally register an OpenTelemetrySdk object.
Configure these components:
An OTLP Span Exporter (for example, OtlpGrpcSpanExporter) - Required for exporting traces to the CloudWatch agent or OpenTelemetry Collector
-
An Amazon X-Ray Propagator – Required for propagating the Trace Context to Amazon Services that are integrated with X-Ray
-
An Amazon X-Ray Remote Sampler – Required if you need to sample requests using X-Ray Sampling Rules
Resource Detectors(for example, EcsResource or Ec2Resource) – Detect metadata of the host running your application
import io.opentelemetry.api.common.Attributes;
import io.opentelemetry.context.propagation.ContextPropagators;
import io.opentelemetry.contrib.aws.resource.Ec2Resource;
import io.opentelemetry.contrib.aws.resource.EcsResource;
import io.opentelemetry.contrib.awsxray.AwsXrayRemoteSampler;
import io.opentelemetry.contrib.awsxray.propagator.AwsXrayPropagator;
import io.opentelemetry.exporter.otlp.trace.OtlpGrpcSpanExporter;
import io.opentelemetry.sdk.OpenTelemetrySdk;
import io.opentelemetry.sdk.resources.Resource;
import io.opentelemetry.sdk.trace.SdkTracerProvider;
import io.opentelemetry.sdk.trace.export.BatchSpanProcessor;
import io.opentelemetry.sdk.trace.samplers.Sampler;
import static io.opentelemetry.semconv.ServiceAttributes.SERVICE_NAME;

// ...

    private static final Resource otelResource =
        Resource.create(Attributes.of(SERVICE_NAME, "YOUR_SERVICE_NAME"))
            .merge(EcsResource.get())
            .merge(Ec2Resource.get());
    private static final SdkTracerProvider sdkTracerProvider =
        SdkTracerProvider.builder()
            .addSpanProcessor(BatchSpanProcessor.create(
                OtlpGrpcSpanExporter.getDefault()
            ))
            .addResource(otelResource)
            .setSampler(Sampler.parentBased(
                AwsXrayRemoteSampler.newBuilder(otelResource).build()
            ))
            .build();
    // Globally registering a TracerProvider makes it available throughout the application to create as many Tracers as needed.
    private static final OpenTelemetrySdk openTelemetry =
        OpenTelemetrySdk.builder()
            .setTracerProvider(sdkTracerProvider)
            .setPropagators(ContextPropagators.create(AwsXrayPropagator.getInstance()))
            .buildAndRegisterGlobal();
Tracing incoming requests (spring framework instrumentation)
- With X-Ray SDK
-
For information on how to use the X-Ray SDK with the spring framework to instrument your application, see AOP with Spring and the X-Ray SDK for Java. To enable AOP in Spring, complete these steps.
- With OpenTelemetry SDK
OpenTelemetry provides instrumentation libraries to collect traces for incoming requests for Spring Boot applications. To enable Spring Boot instrumentation with minimal configuration, include the following dependency.
<dependency>
           <groupId>io.opentelemetry.instrumentation</groupId>
            <artifactId>opentelemetry-spring-boot-starter</artifactId>
        </dependency>
For more information on how to enable and configure Spring Boot instrumentation for your OpenTelemetry setup, see OpenTelemetry's Getting started.
- Using OpenTelemetry-based Java agents
The default recommended method for instrumenting Spring Boot applications is by using the OpenTelemetry Java agent with bytecode instrumentation, which also provides more out-of-the-box instrumentations and configurations when compared to directly using the SDK.
For get started, see Zero code automatic instrumentation solution.
Amazon SDK v2 instrumentation
- With X-Ray SDK
-
The X-Ray SDK for Java can automatically instrument all Amazon SDK v2 clients when you added the aws-xray-recorder-sdk-aws-sdk-v2-instrumentor sub-module in your build.
To instrument individual clients downstream client calls to Amazon services with Amazon SDK for Java 2.2 and later, the aws-xray-recorder-sdk-aws-sdk-v2-instrumentor module from your build configuration was excluded
and the aws-xray-recorder-sdk-aws-sdk-v2 module was included. Individual clients were instrumented by configuring them with a TracingInterceptor.
import com.amazonaws.xray.interceptors.TracingInterceptor;
import software.amazon.awssdk.core.client.config.ClientOverrideConfiguration
import software.amazon.awssdk.services.dynamodb.DynamoDbClient;
//...

public class MyModel {
  private DynamoDbClient client = DynamoDbClient.builder()
    .region(Region.US_WEST_2)
    .overrideConfiguration(
      ClientOverrideConfiguration.builder()
        .addExecutionInterceptor(new TracingInterceptor())
        .build()
      )
    .build();
//...
- With OpenTelemetry SDK
-
To automatically instrument all Amazon SDK clients, add the opentelemetry-aws-sdk-2.2-autoconfigure sub-module.
<dependency>
            <groupId>io.opentelemetry.instrumentation</groupId>
            <artifactId>opentelemetry-aws-sdk-2.2-autoconfigure</artifactId>
            <version>2.15.0-alpha</version>
            <scope>runtime</scope>
        </dependency>
To instrument individual AmazonSDK clients, add the opentelemetry-aws-sdk-2.2 sub-module.
<dependency>
            <groupId>io.opentelemetry.instrumentation</groupId>
            <artifactId>opentelemetry-aws-sdk-2.2</artifactId>
            <version>2.15.0-alpha</version>
            <scope>compile</scope>
        </dependency>
Then, register an interceptor when creating an Amazon SDK Client.
import io.opentelemetry.instrumentation.awssdk.v2_2.AwsSdkTelemetry;

// ...

    AwsSdkTelemetry telemetry = AwsSdkTelemetry.create(openTelemetry);
    private final S3Client S3_CLIENT = S3Client.builder()
      .overrideConfiguration(ClientOverrideConfiguration.builder()
        .addExecutionInterceptor(telemetry.newExecutionInterceptor())
        .build())
      .build();
Instrumenting outgoing HTTP calls
- With X-Ray SDK
-
To instrument outgoing HTTP requests with X-Ray, the X-Ray SDK for Java’s version of the Apache HttpClient was required.
import com.amazonaws.xray.proxies.apache.http.HttpClientBuilder;
...
  public String randomName() throws IOException {
    CloseableHttpClient httpclient = HttpClientBuilder.create().build();
- With OpenTelemetry SDK
-
Similarly to the X-Ray Java SDK, OpenTelemetry provides an ApacheHttpClientTelemetry class that has a builder method that allows creation of an
instance of an the HttpClientBuilder to provide OpenTelemetry-based spans and context propagation for Apache HttpClient.
<dependency>
            <groupId>io.opentelemetry.instrumentation</groupId>
            <artifactId>opentelemetry-apache-httpclient-5.2</artifactId>
            <version>2.15.0-alpha</version>
            <scope>compile</scope>
        </dependency>
The following is a code example from the opentelemetry-java-instrumentation
. The HTTP Client provided by newHttpClient() will generate traces for executed requests.
import io.opentelemetry.api.OpenTelemetry;
import io.opentelemetry.instrumentation.apachehttpclient.v5_2.ApacheHttpClientTelemetry;
import org.apache.hc.client5.http.classic.HttpClient;
import org.apache.hc.client5.http.impl.classic.HttpClientBuilder;

public class ApacheHttpClientConfiguration {

  private OpenTelemetry openTelemetry;

  public ApacheHttpClientConfiguration(OpenTelemetry openTelemetry) {
    this.openTelemetry = openTelemetry;
  }

  // creates a new http client builder for constructing http clients with open telemetry instrumentation
  public HttpClientBuilder createBuilder() {
    return ApacheHttpClientTelemetry.builder(openTelemetry).build().newHttpClientBuilder();
  }

  // creates a new http client with open telemetry instrumentation
  public HttpClient newHttpClient() {
    return ApacheHttpClientTelemetry.builder(openTelemetry).build().newHttpClient();
  }
}
Instrumentation support for other libraries
Find the full list of supported Library instrumentations for OpenTelemetry Java in its respective instrumentation GitHub repository , under Supported libraries, frameworks, application servers, and JVMs
.
Alternatively, you can search the OpenTelemetry Registry to find out if OpenTelemetry supports instrumentation.
To start searching, see Registry.
Manually creating trace data
- With X-Ray SDK
-
With the X-Ray SDK, the beginSegment and beginSubsegment methods are needed to manually create X-Ray segments and sub-segments.
  Segment segment = xrayRecorder.beginSegment("ManualSegment");
        segment.putAnnotation("annotationKey", "annotationValue");
        segment.putMetadata("metadataKey", "metadataValue");

        try {
            Subsegment subsegment = xrayRecorder.beginSubsegment("ManualSubsegment");
            subsegment.putAnnotation("key", "value");

            // Do something here

        } catch (Exception e) {
            subsegment.addException(e);
        } finally {
            xrayRecorder.endSegment();
        }
- With OpenTelemetry SDK
You can use custom spans to monitor the performance of internal activities that are not captured by instrumentation libraries. Note that only span kind server are converted into X-Ray segments, all other spans are converted into
X-Ray sub-segments.
First, you will need to create a Tracer in order to generate spans, which you can obtain through the openTelemetry.getTracer method. This will provide a Tracer instance from the TracerProvider that was registered globally in the
Manual instrumentation solutions with the SDK example. You can create as many Tracer instances as needed, but it is common to have one Tracer for an entire application.
Tracer tracer = openTelemetry.getTracer("my-app");
You can use the Tracer to create spans.
import io.opentelemetry.api.common.AttributeKey;
import io.opentelemetry.api.trace.Span;
import io.opentelemetry.api.trace.SpanKind;
import io.opentelemetry.api.trace.Tracer;
import io.opentelemetry.context.Scope;

...

// SERVER span will become an X-Ray segment
Span span = tracer.spanBuilder("get-token")
  .setKind(SpanKind.SERVER)
  .setAttribute("key", "value")
  .startSpan();
try (Scope ignored = span.makeCurrent()) {

  span.setAttribute("metadataKey", "metadataValue");
  span.setAttribute("annotationKey", "annotationValue");

  // The following ensures that "annotationKey: annotationValue" is an annotation in X-Ray raw data.
  span.setAttribute(AttributeKey.stringArrayKey("aws.xray.annotations"), List.of("annotationKey"));

  // Do something here
}

span.end();
Spans have a default type of INTERNAL.
// Default span of type INTERNAL will become an X-Ray subsegment
Span span = tracer.spanBuilder("process-header")
  .startSpan();
try (Scope ignored = span.makeCurrent()) {
  doProcessHeader();
}
Adding annotations and metadata to traces with OpenTelemetry SDK
In the above example, the setAttribute method is used to add attributes to each span. By default, all the span attributes will be converted into metadata in X-Ray raw data. To ensure that an attribute is converted into an
annotation and not metadata, the above example adds that attribute’s key to the list of the aws.xray.annotations attribute. For more information, see Enable the Customized X-Ray Annotations
and Annotations and metadata.
With OpenTelemetry-based Java agents
If you are using the Java agent to automatically instrument your application, you need to perform manual instrumentation in your application. For example, to instrument code within the application for sections that are not covered by any auto-instrumentation library.
To perform manual instrumentation with the agent, you need to use the opentelemetry-api artifact. The artifact version cannot be newer than the agent version.
import io.opentelemetry.api.GlobalOpenTelemetry;
import io.opentelemetry.api.trace.Span;

// ...

        Span parentSpan = Span.current();
        Tracer tracer = GlobalOpenTelemetry.getTracer("my-app");
        Span span = tracer.spanBuilder("my-span-name")
            .setParent(io.opentelemetry.context.Context.current().with(parentSpan))
            .startSpan();
        span.end();
Lambda instrumentation
- With X-Ray SDK
-
Using the X-Ray SDK, after your Lambda has Active Tracing enabled, there is no additional configuration required to use the X-Ray SDK. Lambda will create a segment representing the Lambda handler invocation, and you can create sub-segments or instrument libraries using the X-Ray SDK without any additional configuration.
- With OpenTelemetry-based solutions
Auto-instrumentation Lambda layers – You can automatically instrument your Lambda with Amazon vended Lambda layers using the following solutions:
Amazon Lambda Layer for OpenTelemetry (Recommended)
This Lambda layer has CloudWatch Application Signals enabled by default, which enables performance and health monitoring for your Lambda application by collecting both metrics and traces.
For just tracing, set the Lambda environment variable OTEL_AWS_APPLICATION_SIGNALS_ENABLED=false.
Amazon managed Lambda layer for ADOT Java. For more information, see Amazon Distro for OpenTelemetry Lambda Support For Java.
To use manual instrumentation along with auto-instrumentation layer, see Manual instrumentation solutions with the SDK. For reduced cold starts, consider using OpenTelemetry manual instrumentation to generate OpenTelemetry traces for your Lambda function.
OpenTelemetry manual instrumentation for Amazon Lambda
Consider the following Lambda function code that makes an Amazon S3 ListBuckets call.
package example;

import com.amazonaws.services.lambda.runtime.Context;
import com.amazonaws.services.lambda.runtime.RequestHandler;

import software.amazon.awssdk.services.s3.S3Client;
import software.amazon.awssdk.services.s3.model.ListBucketsRequest;
import software.amazon.awssdk.services.s3.model.ListBucketsResponse;
import software.amazon.awssdk.services.s3.model.S3Exception;

public class ListBucketsLambda implements RequestHandler<String, String> {

    private final S3Client S3_CLIENT = S3Client.builder()
        .build();

    @Override
    public String handleRequest(String input, Context context) {
        try {
            ListBucketsResponse response = makeListBucketsCall();
            context.getLogger().log("response: " + response.toString());
            return "Success";
        } catch (Exception e) {
            throw new RuntimeException(e);
        }
    }

    private ListBucketsResponse makeListBucketsCall() {
        try {
            ListBucketsRequest listBucketsRequest = ListBucketsRequest.builder()
                .build();
            ListBucketsResponse response = S3_CLIENT.listBuckets(listBucketsRequest);
            return response;
        } catch (S3Exception e) {
            throw new RuntimeException("Failed to call S3 listBuckets" + e.awsErrorDetails().errorMessage(), e);
        }
    }
}
Here are the dependencies.
dependencies {
    implementation('com.amazonaws:aws-lambda-java-core:1.2.3')
    implementation('software.amazon.awssdk:s3:2.28.29')
    implementation('org.slf4j:slf4j-nop:2.0.16')
}
To manually instrument your Lambda handler and the Amazon S3 client, do the following.
Replace your function classes that implement RequestHandler (or RequestStreamHandler) with those that extend TracingRequestHandler (or TracingRequestStreamHandler).
Instantiate a TracerProvider and globally register an OpenTelemetrySdk object. The TracerProvider is recommended to be configured with:
A Simple Span Processor with an X-Ray UDP span exporter to send Traces to Lambda’s UDP X-Ray endpoint
A ParentBased always on sampler (Default if not configured)
A Resource with service.name set to the Lambda function name
An X-Ray Lambda propagator
Change the handleRequest method to doHandleRequest and pass the OpenTelemetrySdk object to the base class.
Instrument the Amazon S3 client with the OpenTemetry Amazon SDK instrumentation by registering the interceptor when building the client.
You need the following OpenTelemetry-related dependencies.
dependencies {
    ...

    implementation("software.amazon.distro.opentelemetry:aws-distro-opentelemetry-xray-udp-span-exporter:0.1.0")

    implementation(platform('io.opentelemetry.instrumentation:opentelemetry-instrumentation-bom:2.14.0'))
    implementation(platform('io.opentelemetry:opentelemetry-bom:1.48.0'))

    implementation('io.opentelemetry:opentelemetry-sdk')
    implementation('io.opentelemetry:opentelemetry-api')
    implementation('io.opentelemetry.contrib:opentelemetry-aws-xray-propagator:1.45.0-alpha')
    implementation('io.opentelemetry.contrib:opentelemetry-aws-resources:1.45.0-alpha')
    implementation('io.opentelemetry.instrumentation:opentelemetry-aws-lambda-core-1.0:2.14.0-alpha')
    implementation('io.opentelemetry.instrumentation:opentelemetry-aws-sdk-2.2:2.14.0-alpha')
}
The following code demonstrates the Lambda function after the required changes. You can create additional custom spans to complement the automatically provided spans.
package example;

import java.time.Duration;

import com.amazonaws.services.lambda.runtime.Context;

import io.opentelemetry.api.common.Attributes;
import io.opentelemetry.context.propagation.ContextPropagators;
import io.opentelemetry.contrib.aws.resource.LambdaResource;
import io.opentelemetry.contrib.awsxray.propagator.AwsXrayLambdaPropagator;
import io.opentelemetry.instrumentation.awslambdacore.v1_0.TracingRequestHandler;
import io.opentelemetry.instrumentation.awssdk.v2_2.AwsSdkTelemetry;
import io.opentelemetry.sdk.OpenTelemetrySdk;
import io.opentelemetry.sdk.resources.Resource;
import io.opentelemetry.sdk.trace.SdkTracerProvider;
import io.opentelemetry.sdk.trace.export.SimpleSpanProcessor;
import io.opentelemetry.sdk.trace.samplers.Sampler;
import static io.opentelemetry.semconv.ServiceAttributes.SERVICE_NAME;
import software.amazon.awssdk.core.client.config.ClientOverrideConfiguration;
import software.amazon.awssdk.services.s3.S3Client;
import software.amazon.awssdk.services.s3.model.ListBucketsRequest;
import software.amazon.awssdk.services.s3.model.ListBucketsResponse;
import software.amazon.awssdk.services.s3.model.S3Exception;
import software.amazon.distro.opentelemetry.exporter.xray.udp.trace.AwsXrayUdpSpanExporterBuilder;

public class ListBucketsLambda extends TracingRequestHandler<String, String> {
    private static final Resource lambdaResource = LambdaResource.get();
    private static final SdkTracerProvider sdkTracerProvider =
        SdkTracerProvider.builder()
            .addSpanProcessor(SimpleSpanProcessor.create(
                new AwsXrayUdpSpanExporterBuilder().build()
            ))
            .addResource(
                lambdaResource
                .merge(Resource.create(Attributes.of(SERVICE_NAME, System.getenv("AWS_LAMBDA_FUNCTION_NAME"))))
            )
            .setSampler(Sampler.parentBased(Sampler.alwaysOn()))
            .build();
    private static final OpenTelemetrySdk openTelemetry =
        OpenTelemetrySdk.builder()
            .setTracerProvider(sdkTracerProvider)
            .setPropagators(ContextPropagators.create(AwsXrayLambdaPropagator.getInstance()))
            .buildAndRegisterGlobal();
    private static final AwsSdkTelemetry telemetry = AwsSdkTelemetry.create(openTelemetry);
    private final S3Client S3_CLIENT = S3Client.builder()
        .overrideConfiguration(ClientOverrideConfiguration.builder()
            .addExecutionInterceptor(telemetry.newExecutionInterceptor())
            .build())
        .build();

    public ListBucketsLambda() {
        super(openTelemetry, Duration.ofMillis(0));
    }

    @Override
    public String doHandleRequest(String input, Context context) {
        try {
            ListBucketsResponse response = makeListBucketsCall();
            context.getLogger().log("response: " + response.toString());
            return "Success";
        } catch (Exception e) {
            throw new RuntimeException(e);
        }
    }

    private ListBucketsResponse makeListBucketsCall() {
        try {
            ListBucketsRequest listBucketsRequest = ListBucketsRequest.builder()
                .build();
            ListBucketsResponse response = S3_CLIENT.listBuckets(listBucketsRequest);
            return response;
        } catch (S3Exception e) {
            throw new RuntimeException("Failed to call S3 listBuckets" + e.awsErrorDetails().errorMessage(), e);
        }
    }
}
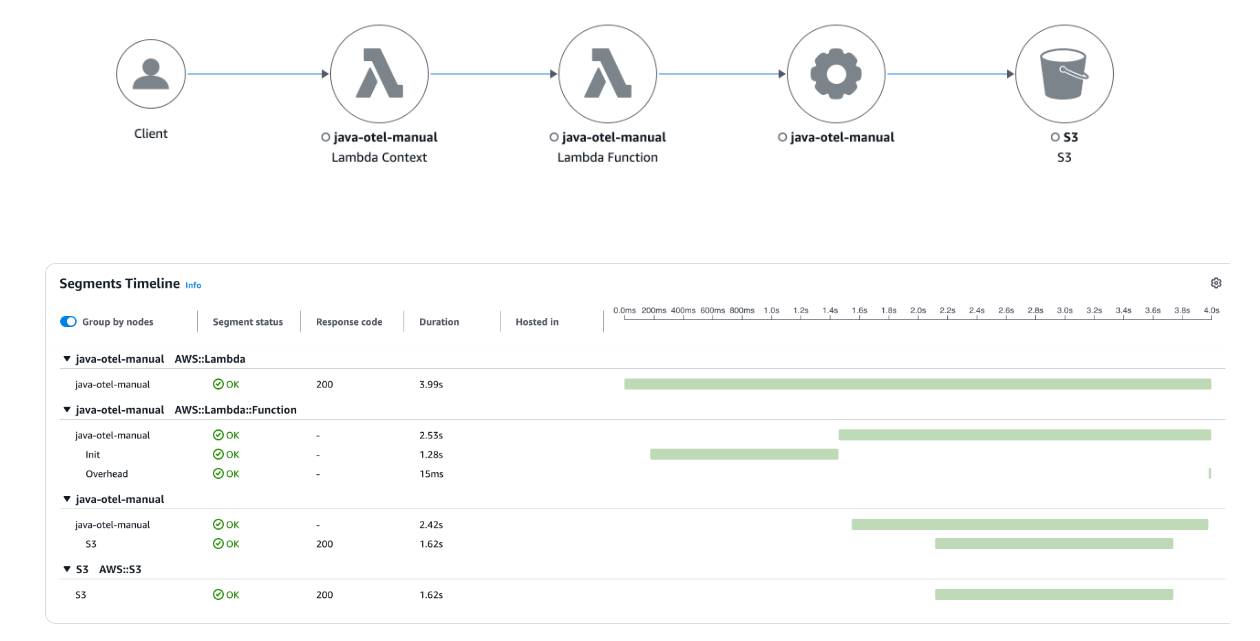
When invoking the Lambda function, you will see the following trace under Trace Map in the CloudWatch console.